
3-D map of Greenland ice sheet offers clues to climate change both past and present
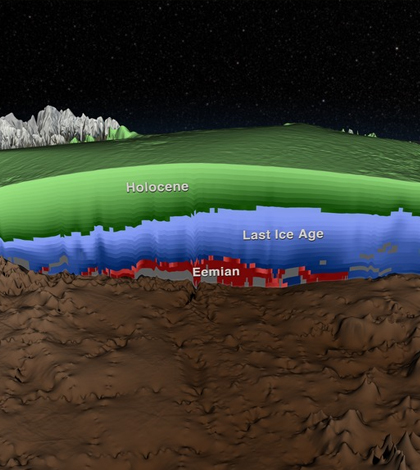
This cross section shows the ages of layers of the Greenland Ice Sheet (Credit: NASA)
Using satellite-mounted and airborne radar systems, scientists can peer into the depths of glaciers and catch a glimpse of climate conditions in the ancient past. Researchers from the University of Texas at Austin drew from decades of data to develop a 3-D layered map of Greenland’s ice sheet, improving the scientific community’s understanding of age structure within the ice.
While coring and radar sounding campaigns have provided plenty of insight into Arctic and Antarctic ice over many decades, NASA’s Operation IceBridge — which began in 2009 — provided a new, rapidly expanding dataset that made the 3-D map a possibility.
“We realized there was an opportunity to really dive into these data and make a comprehensive map of the layering of the ice sheet,” said Joe MacGregor, a glaciologist in UT at Austin’s Institute for Geophysics. “We knew that would be a challenging process, but also a very rewarding one.”
MacGregor led the development of the project’s proposal as a post-doctoral researcher, and became the science and management lead on the project, which continues today. He and his team selected Greenland as the subject of the map and study for its extensive, homogeneous dataset.
The many layers in Greenland’s ice sheet, MacGregor explained, record “discreet, short-lived climate events” by integrating changes to the internal and external electrical properties of the ice from those events. Over millennia, snowfall buries and distorts those layers, rendering their climatological fingerprints unreadable without high-resolution radar.
Over the last two decades, radar range resolution has improved by at least a factor of two, MacGregor said. “[That] may not sound like much, but when it comes to resolving layering, it’s extremely helpful.”
The new map provides the first-ever three-dimensional view of an ice sheet as constrained by radar data, and offers some insight into the relationship between the ice’s age, depth and flow. It also reveals that the oldest ice in Greenland occurs in the central-northern region of the country, information MacGregor says is helping formulate hypotheses about the ice sheet’s response to an ancient period of warmth not dissimilar from the one we’re living in today.
“If we want to have a better handle on how the Greenland ice sheet is going to respond on millennial time scales to the kick that we’re giving it, then we should look to this oldest ice and sample it to understand what that ice sheet has done in the past and how extensive it was,” he said.
MacGregor sees himself as a “Johnny-come-lately” to the study of Greenland’s ice sheet, but he has big plans for future research. He and his team aim to determine the average rate of snowfall on the ice sheet, a parameter that helps bridge the relationship between oceanic ice discharge and climate change. They also want to apply the analytical techniques from this study to older radar data.
“Ice sheets have very long memories,” MacGregor said. “They’ll be responding to changes in climate forcing experienced over the last decades and centuries for a very long time to come.”
Top image: This cross section shows the ages of layers of the Greenland Ice Sheet (Credit: NASA)


0 comments