
Cloud Cover Data Useful For Estimating Biodiversity
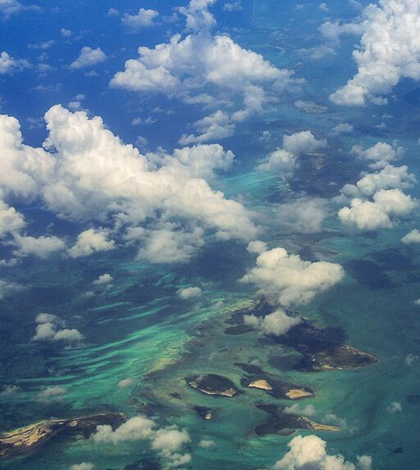
Clouds over small Caribbean islands. (Credit: Adam Wilson / University at Buffalo)
In years past, predictions of biodiversity around the world have been based on precipitation and temperature data recorded by weather stations. This in one way makes sense because the two measurements are related to plant productivity that animal life typically springs up around. But in another way, the approach is a little imperfect.
That’s because there aren’t weather stations in a lot of places around the world. Especially in regions like Sub-Saharan Africa or the Amazon basin, few stations provide the data needed. As a result, experts estimating biodiversity have to predict temperature and precipitation in between existing stations, usually with some form of statistics, and plug those into models. That could involve estimating data for areas of more than 1,000-square kilometers in some cases.
But researchers at the University at Buffalo say there is a better way to come at biodiversity estimates. Instead of taking the ground-based approach to getting data, the scientists have shown the utility of remote-sensing data in making better predictions using cloud cover.
“With our approach, there’s no statistical interpolation at all,” said Adam Wilson, assistant professor of geography at U. at Buffalo. He completed most of the research while a graduate student at Yale University. “It has the potential to improve our understanding of climate, globally, in areas that have few weather stations.”
All of the work relied on images taken from NASA satellites Terra and Aqua that are equipped with Moderate Resolution Imaging Spectroradiometers. Wilson and a Yale co-author went back to the year 2000 in the dataset and took two images per day of cloud cover for almost every kilometer of Earth. The massive set of images, coming in at around 260 terabytes in size, stretched from 2000 to 2014.

Fine-grain spatio-temporal cloud dynamics visualized with a metric of seasonal concentration, which combines the magnitude and timing of monthly fluctuations in cloud frequency derived from 15 years of twice-daily satellite observations. It illustrates the often remarkably sharp transitions between many of the world’s terrestrial ecosystems. The hue indicates the month of peak cloudiness, while the saturation and value indicate the magnitude of the concentration ranging from 0 (black, all months are equally cloudy) to 100 (all clouds are observed in a single month). Coastlines shown in white, marine areas with no data are dark grey. (Credit: Adam Wilson / University at Buffalo)
Compiling all the images let the scientists determine the frequency of cloudy days for each area of Earth, illuminating transitions between biomes at a 1-kilometer resolution.
“Clouds affect leaf wetness, soil moisture and in many ways affect local conditions,” said Wilson, discussing the appeal of the remote-sensing approach. “And it’s quite easy to see them from space.”
Because tracking clouds is so easy, it was very simple to relate their abundance with the distributions and sizes of two test species. One was a South American bird called the montane woodcreeper and the other was a shrub species called king protea.
And that’s something that’s possible with other plants or animals around the world.
“It’s a useful example to show how the dataset can work,” said Wilson, referencing the bird’s distribution found to be in cloud forests in the Andes. “But the primary focus of the paper was gathering the cloud data.”
Wilson says that researchers who use the data in the future will be able to find more interesting ways to employ it, expanding its effectiveness to uncovering species limitations elsewhere. With that in mind, all of the data have been posted online to www.earthenv.org, where scientists anywhere can access them. The site also includes neat tools allowing visitors to play with maps of the Earth under different data layers.
And that is just one hope that he has for the results, noting the goals that the United Nations’ Convention on Biological Diversity has in the future.
“This is a governmental agreement that has targets for 2020, which is only five years away,” said Wilson. “One goal of those targets is to improve the concentration of biodiversity. That’s a useful goal, but a big challenge is how do you know if you’re making progress? These new cloud data are just one small contributor to understanding how the global environment is changing. … They’re a small contributor to a larger effort, another tool in the toolbox we can bring to bear in quantifying Earth’s biodiversity.”
Full results of the study are published online in the open-access journal PLOS Biology.
Top image: Clouds over small Caribbean islands. (Credit: Adam Wilson / University at Buffalo)


0 comments