
El Niño And La Niña
El Niño infographic. (Credit: Nate Christopher / Fondriest Environmental)
The 2015-2016 El Niño has already gone down as one of the strongest ever in history. Some of its effects have included droughts as well as storms and flooding. It may very well have also been a factor in coral stress and die-off around the globe.
Part of its strength, according to scientists at the National Oceanic and Atmospheric Administration, was due to a developing El Niño in 2014 that never materialized. Despite that, the processes at play very likely gave the most recent El Niño a head start.
But nowadays, La Niña is beginning to take hold, promising a large shift in weather patterns once again. What are some of the impacts to look forward to? Essentially, patterns are expected to be much the opposite to what they were under El Niño, according to Washington State University researchers. So areas that received rains could be hit with droughts, while regions that had heat waves may experience a cool down.
With all the impacts that these two opposing weather phenomena could bring, we put together an infographic in the Winter 2016 edition of the Environmental Monitor to give readers some background. In it, we give a brief overview of each and take a look at the past cycles of the El Niño – Southern Oscillation that is linked to temperature and weather changes in the Tropical Pacific Ocean. We also take a look at the mounting impacts of the 2015-2016 El Niño, which at time of print was just getting started.
If you would like a full-size version of the infographic for personal use, one is available for download on the Fondriest Environmental Flickr page.
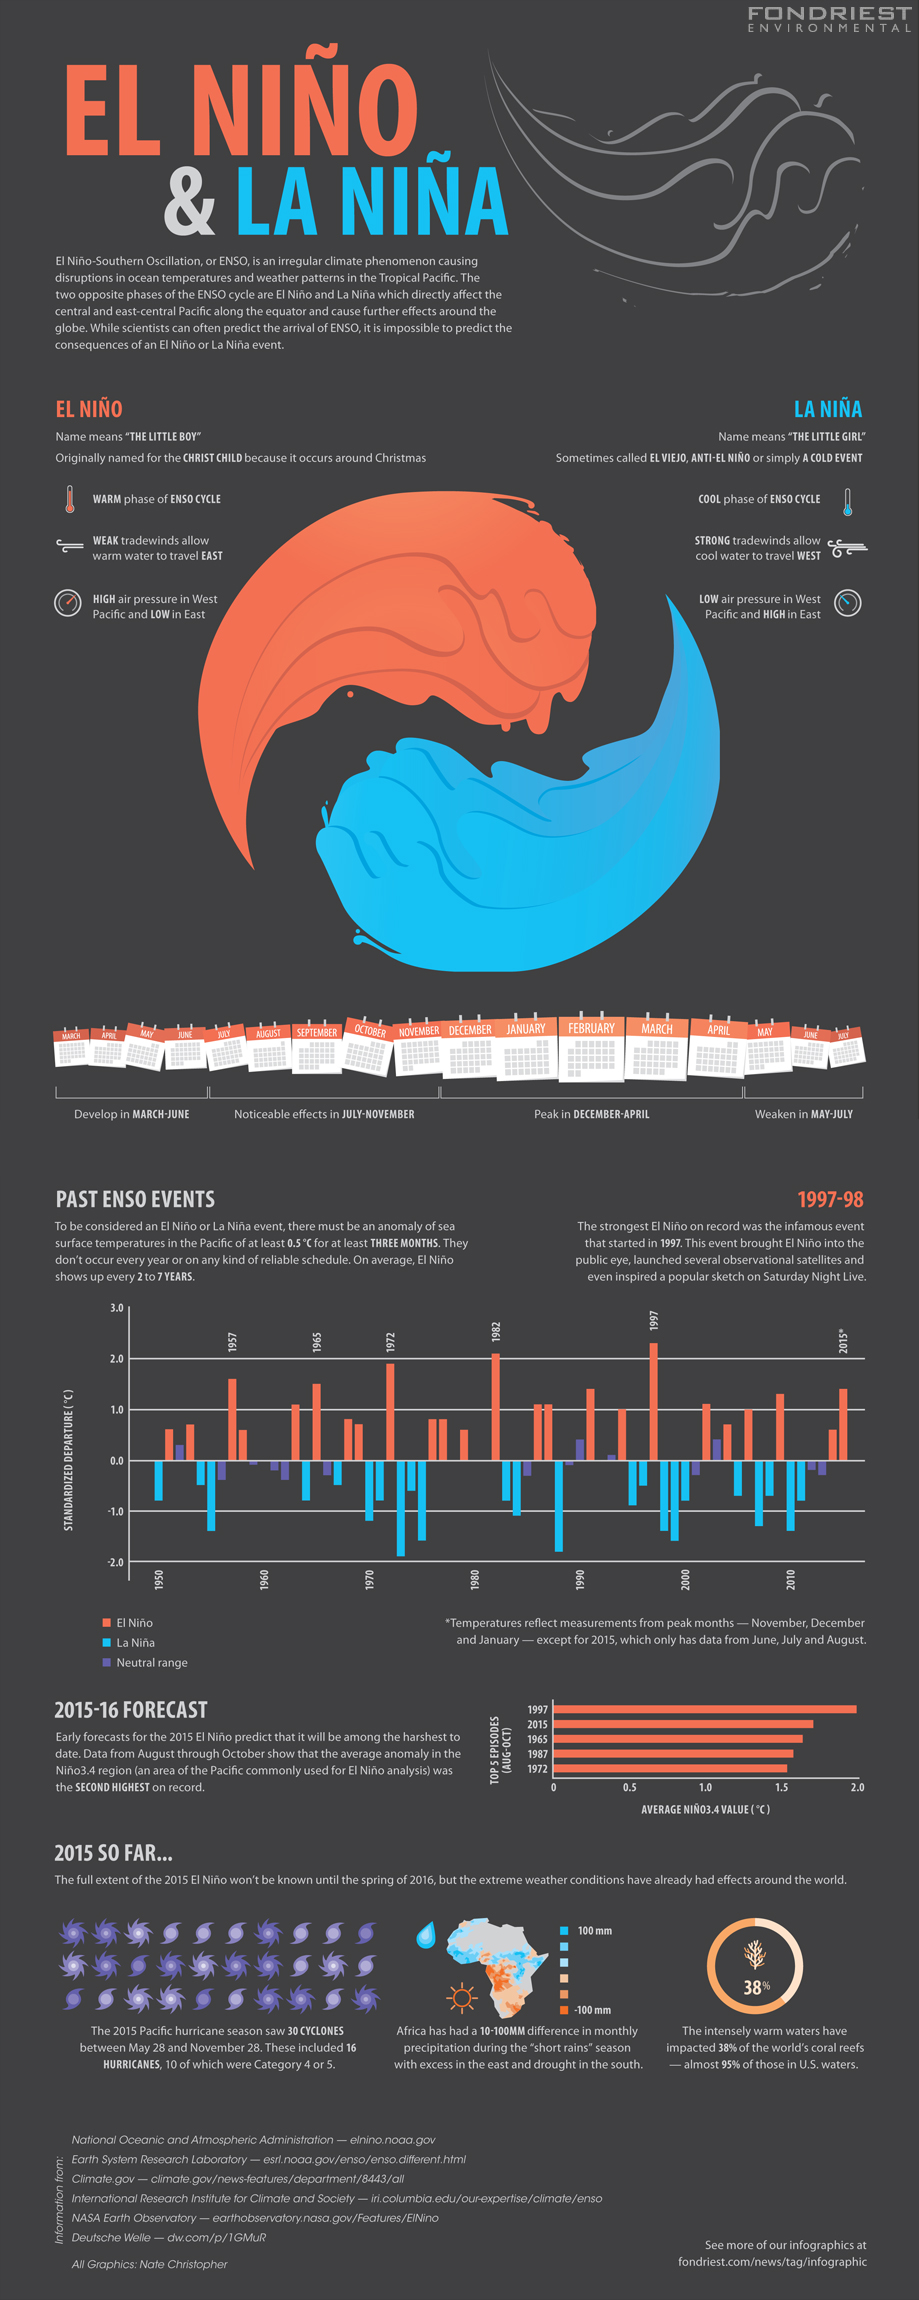
El Niño infographic. (Credit: Nate Christopher / Fondriest Environmental)


0 comments