
Fiber optic temperature measurements in McMurdo Ice Shelf improve melting data
Fiber optics have revolutionized telecommunications worldwide, linking countries and continents to make much of the technology we rely on today possible. But the small-yet-mighty cables hold another promise: Scientists can use them to monitor minute temperature changes along a single line. This capability holds much promise for tracking changes in Earth’s ice sheets.
A team of researchers led by scientists at the University of Nevada, Reno, tested out the idea on Antarctica’s McMurdo Ice Shelf, monitoring temperature changes there over a course of 14 months beginning in 2011. They found that using fiber optics in such an application is highly reliable and accurate — even more so than satellite measurements, they say.
“We ran through the Antarctic winter and had a solar panel and wind turbine for power. The idea was to test out how we can drill through the ice fast, with limited logistics, to get temperature data to work with,” said Scott Tyler, professor of hydrology at the University of Nevada, Reno. “And generally speaking, we had success on all counts.”
The approach, says Tyler, took quite a bit of setup. The team had to drill 200 meters into the ice while seawater at the bottom of the drilling path kept threatening to freeze their hole shut. With the impending re-freeze on the way, Tyler says the team only had 20 minutes to run the line.
But beyond that, there weren’t many headaches. And the operation of the fiber optic cable itself is pretty straightforward.
“We’re looking at the backscattered light down the optical fiber. The reflected color itself is related to temperature,” said Tyler. “I like to say it’s like seeing sparkles of dust in a room when you turn on a flashlight. We’re looking at the wavelengths coming back.”
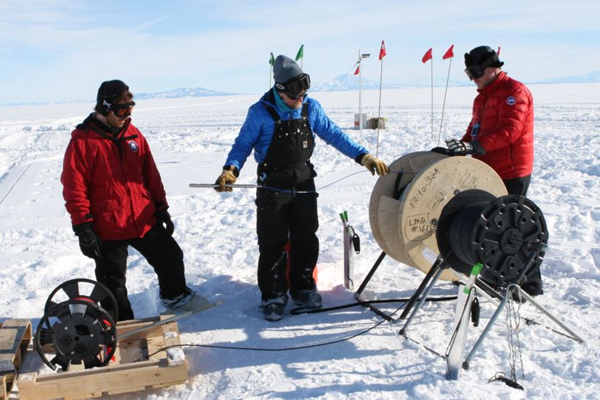
Fiber optic cables and pressure sensors were lowered down into holes drilled in the ice. (Credit: Victor Zagorodnov)
Data were recorded using surface-deployed loggers that transferred information back to researchers via satellite. And Tyler says that they were able to amass more than 5 million temperature measurements at the site.
During the 14-month period, scientists documented warm ocean waters coming in under the shelf during the summer, which had warmed by about 1 degree Celsius. They were also able to chart actions of the ice shelf as it melted and shifted naturally. Tyler says the waters below the shelf were warmer in the summer. Melting of the sheet slowed in the winter months when waters cooled down.
“This is the first time we’ve measured ice shelf melting from below over a long period of time,” said Tyler.
Next up for the fiber-optic method is to see if it can be deployed in a large-scale effort across different ice sheets. Tyler and others are putting together applications to the National Science Foundation with hopes of installing others in the near future.
“We’ve proven it works well and we’ve gotten better data than we expected,” said Tyler. “We’re pretty optimistic that we can set up a series of monitoring points to see if changes are progressing due to climate change or steady rates.”
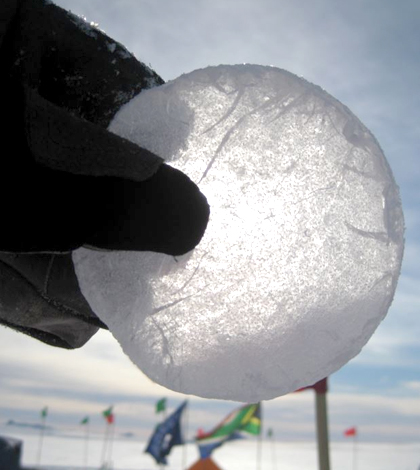
Top image: A sample of ice retrieved during the drilling process. (Credit: David Holland)


0 comments