
On Great Pond, “Goldie” the data buoy tracks a pristine lake in slow decline
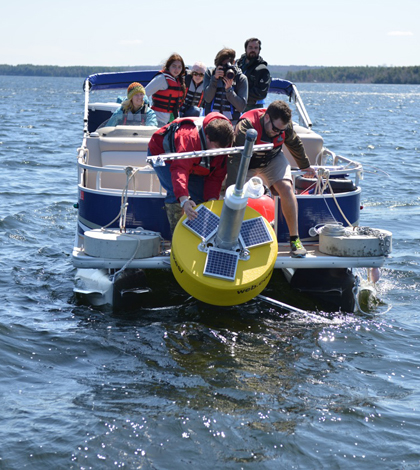
A crew launches "Goldie," the Great Pond data buoy (Credit: Colby College)
To the average observer, the Belgrade Lakes in Maine may not look like they’re in any particular distress.
“If you were to travel the country and you were to come to these lakes, you’d say ‘Oh my God,'” said Whitney King, a chemistry professor at Colby College in Waterville. “You can see 25 feet down into the water.”
But this is Maine, where the standards are a little higher. The lakes look pristine, but the scientists who have watched them over the past decade or so say their water quality is in the midst of a slow decline — the sort of decline often punctuated by a very rapid switch to significantly degraded ecosystem.
A watershed management plan is under development for Great Pond, a Belgrade Lake that the play and Academy Award-winning film “On Golden Pond” are based on. The plan will guide a multimillion-dollar effort to get the watershed community to alter their development practices to cut the phosphorus flowing into the lake.
“Goldie,” a bright-yellow data buoy named for the film the lake inspired, is providing information to help scientists track how the water quality changes, for better or worse. King and his students are also working on a custom website to quickly interpret the complex, real-time data for people who live around the lake.
“In order to catch people’s attention and promote conservation behavior, they need immediate results,” King said. “They don’t want to wait until next spring to see the data for this summer.”
King knows what the people want because they got a chance to tell him. Lake residents have made their interests clear at gatherings at the Maine Lakes Resource Center, a new $2.5 million facility in the Belgrade Lakes area built through a collaboration between Colby College, the Belgrade Lakes Association and other partners.

A recent version of the dashboard that will interpret buoy data on Great Pond for lake residents. (Credit: Whitney King/Colby College)
One thing residents want to be able to see in the data is how the Great Pond is changing from one year to another. King and his students are working on a website that he says is modeled after the Weather Underground, a data-heavy online service with easy access to historical data, descriptive forecasts and weather discussion.
The website will include an interpretive graphic that uses buoy data to illustrate lake functions like stratification, oxygen levels and water clarity. There are also more complex graphics that might be intimidating to a layperson. But with a little narrative descriptions and context from other years, even those should help residents better understand what’s happening on Great Pond.
For example, a preliminary graphic made available by King shows two graphs of oxygen concentration and Schmidt stability index — a calculation of how much energy it would take to mix the lake — in 2013 and 2014. The stability index is useful for their scientific interests in what’s happening with deep oxygen, stratification and surface productivity. That could get complicated, but the trends in oxygen each year are clear.

Trends in oxygen concentrations (in red) on Great Pond for 2013 and 2014 (Credit: Whitney King/Colby College)
“You can watch it go from saturated into the tank,” King said. “We went completely anoxic almost two weeks earlier in 2014 versus 2013.”
They’re still working on perfecting the tools to best communicate these parameters to the public, which remain’s the project’s biggest challenge. Getting the buoy and servers up and running was the easy part, said King, who codes and builds scientific instruments.
King’s inclination towards tinkering came in handy when it came to the buoy’s fluorescence sensor. The oxygen and stability graphic includes algal biomass for 2014 but not 2013, a result of insufficient sensor wiping in the previous year to keep it free of biofouling. The buoy has an automated wiper that keeps its PAR sensor clean, so King engineered that device to clean both sensors in one swipe by integrating a few more household bristles.
“So my toothbrush now wipes my fluorescence sensor,” King said. “It works much better.”
Top image: A crew launches “Goldie,” the Great Pond data buoy (Credit: Colby College)


0 comments