
Infographic: Harmful algal blooms
Harmful algal blooms infographic
The past few print editions of the Environmental Monitor have featured exclusive infographics on important environmental issues from our designer Nate Christopher. Starting today, we’ll begin featuring those online.
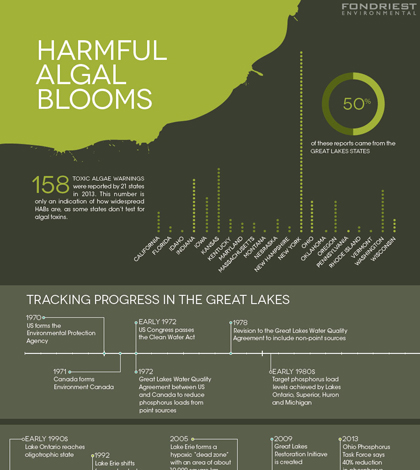
After a summer in which a toxic algal bloom in Lake Erie cut off 500,000 people in Toledo, Ohio, from the public drinking water supply, it seems apt to start with Nate’s take on harmful algal blooms from the Spring 2014 issue (PDF).
We cover harmful algal blooms often here on the Monitor. This past summer I wrote about a water quality buoy near Toledo’s water intake crib in Lake Erie, a project that was hastened by the bloom disrupted the city’s water supply. Earlier this month, Alex Card reported on a study that found cyanobacteria in Lake Erie appear to have grown more sensitive to phosphorus loads, “which suggests that we’ll be hearing about bigger, badder blooms more frequently,” Alex wrote.
The infographic is below. Click for the full-sized version.

Algal blooms infographic (Credit: Nate Christopher / Fondriest Environmental)
4 Comments
Leave a Reply


Pingback: Algal Bloom Researchers Adjust to Demand for Data - Great Lakes Connection / Connexion Grands Lacs
Pingback: FishSens Magazine | PCB Levels Continue To Drop In Lake Michigan - FishSens Magazine
Pingback: Research Brief: Satellite Monitoring of Eutrophication in the Caspian Sea - Lake Scientist
Pingback: Research Brief: Modeling Harmful Algal Blooms with Machine Learning - Lake Scientist