
Latest Satellite and Eddy Covariance Data Shows Vulnerability of Trees to Drought
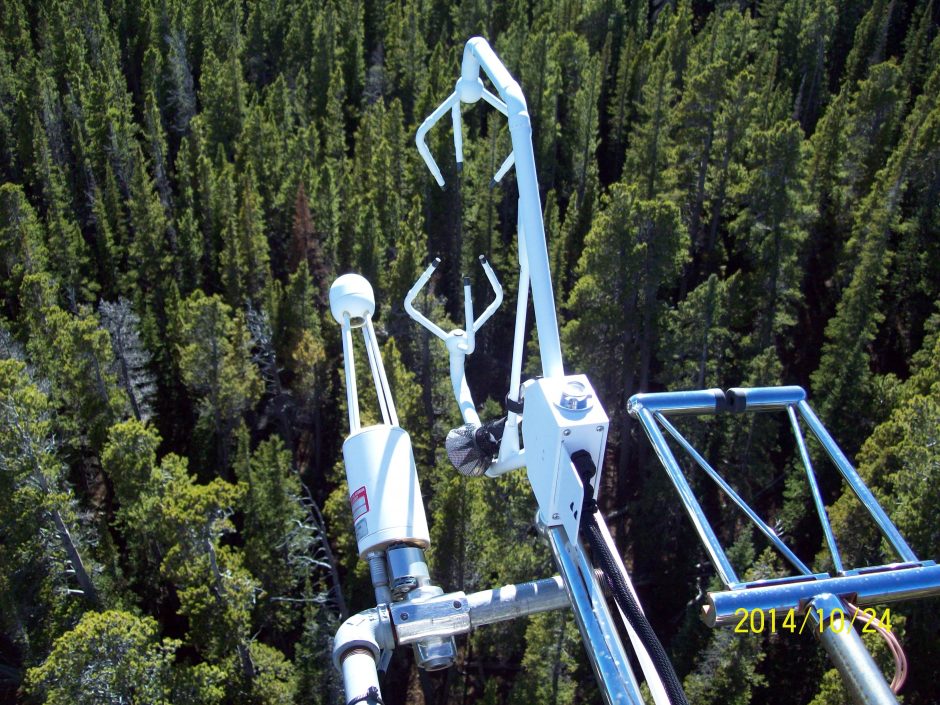
Eddy covariance equipment at 33 meter West (USGS) Tower. (Credit: USGS)
William Anderegg, assistant professor of biology at the University of Utah, has spent years studying drought-stricken trees all over the world. As climate change is expected to cause increased drought severity in the future, the work of Anderegg and his colleagues becomes increasingly important. In a previous interview for the Environmental Monitor, Anderegg found that a tree’s hydraulic safety margin was the best indicator of whether a tree would survive drought. The hydraulic safety margin is an expression of how the tree reacts under drought conditions, where there is very little water being pulled up the tree’s transport system and air is being pulled up instead. “It’s like a heart attack for the tree,” he noted.
In his latest work, funded by the National Science Foundation and NASA, published recently in Nature, Anderegg and his colleagues gained an even better understanding of tree response in drought, gathering data on trees all over the world using a vast network of cutting-edge satellite and ground level sensor systems. In this work, they were able to show that trees in the tropics and boreal regions are the most sensitive to drought, and that tree recovery takes longer than a few days after the return of rain. Recovery can take years, and trees hit by drought again while still recovering have an especially difficult time returning to normal, the team found.
The primary metric used to monitor drought was total photosynthesis by an ecosystem, called Gross Primary Productivity (GPP). The GPP is used for assessing ecosystem health and how much carbon is taken out of the air.
Several different methods were used to monitor GPP. One method used by the U. of Utah team was MODIS sensor data from NASA’s TERRA satellite. The MODIS sensor gives a good estimate of the chlorophyll level, which is proportional to the GPP level. The chlorophyll level and distribution essentially captures the “total greenness,” or overall productivity of the area. The satellite data was taken using a grid covering the Earth, with each grid square measuring 250 by 250 meters.
Global maps are made daily by the satellite, but Anderegg and colleagues were interested primarily in the monthly average of all the daily images taken. By using the average, they were able to get a reasonable picture of the health of the area without cloud cover interference, something that can obscure a daily image but can be eliminated through monthly averaging.

Eddy covariance equipment in a grassland. (Credit: FLUXNET)
The NASA data is freely and publicly available. Anderegg’s team also used a machine learning algorithm called “random forest” to process the data, which is like multiple regression but more flexible.
A second GPP monitoring method used by Anderegg and colleagues was eddy covariance towers. Eddy covariance towers can measure ecosystem photosynthesis. When photosynthesis is occurring, the air will be enriched in water and depleted in carbon dioxide. The tower’s anemometer indicates that wind is moving CO2 and water, and a different sensor monitors and records water and CO2 levels continuously. It also measures wind speed.
The towers vary in height depending on the surrounding terrain, measuring anywhere from 6 to 10 feet tall in grasslands, up to hundreds of feet in the jungle. The area being monitored varied depending on the height of the eddy covariance tower, typically 30 by 30 meters for a grassland region and one square kilometer for a dense forest area. Hundreds of eddy covariance towers dot the globe. A statistical model was used that interpolated data monitoring information between towers. Data was assembled by the Max Planck Institute.
“The true level of drought on a global scale is not known. Its level is reflected to some degree by each of the methods, but we don’t know which measure is the ‘true’ measure,” says Anderegg.
While it may seem like we are helpless in the face of drought, that is not the case. Anderegg says, “We can build the resilience of ecosystems. Maintaining diversity can increase regional resistance. We can also monitor trends and we can create resilient subcultures.”
Top image: Eddy covariance equipment at 33 meter West (USGS) Tower. (Credit: USGS)


0 comments