
NASA science flights, laser altimeters track changes in Greenland Ice Sheet
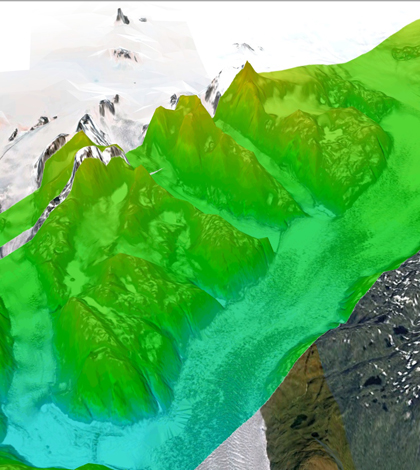
LVIS elevation and slope data over the Qajuuttap Glacier in Southern Greenland from a 2012 mission (Credit: NASA Goddard Space Flight Center)
Natives of Greenland are used to the Arctic nation’s winter darkness, which only permits three to four hours of sunlight every day. As it turns out, many NASA researchers are not.
“We normally go in the spring, when there are 20 hours of daylight,” said Michelle Hofton, a remote sensing scientist at the University of Maryland and mission scientist for NASA’s Land Vegetation & Ice Sensor study. That wasn’t the case when she and other researchers completed nine daylong research flights to measure changes in the height of the Greenland Ice Sheet and surrounding Arctic ice in October. The data they collected will be compared to other sets and serve as a reference point for future research.
“I think three weeks is long enough,” said Hofton, referring to living and conducting research with 20 hours of darkness each day. “We began to look forward to the days when we flew south instead of north and got to see the sunlight.”
The darkness was a small hindrance, and the researchers weren’t used to it for good reason. The mission marks the first time that NASA has compared seasonal changes in the area. The first set of data collected in 2013, in the spring with more sunlight to burn, serves as the baseline. “It helps us put a context to the long-term changes occurring in the region,” said Hofton.
Greenland is the second largest body of ice in the world, after Antarctica, and its melting has an impact on sea-level rise. By measuring seasonal changes, models for predicting future ocean levels can be made more accurate.
Flights that took place in the spring were carried out at low altitudes and used more sensors than were used on the winter flights. The winter crew flew at higher altitudes inside a C-130 Hercules. The plane was equipped with two laser altimeters and cameras, though Hofton says it was too dark for good imagery.
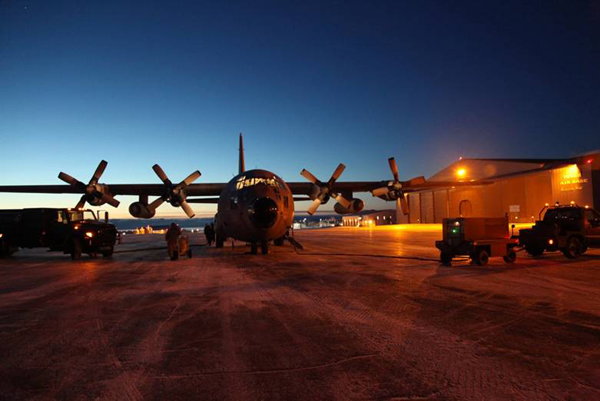
The C130 parked outside the hanger at Thule Air Base in Greenland (Credit: The LVIS team)
Laser altimeters determine the distance to the surface by measuring the time of flight of a flash of laser radiation. In this study’s case, the laser pulses traveled down to the top of the ice, which reflected them back toward the C-130. The time for the pulse to return was measured and then the distance was calculated considering the speed of light. When compared to the spring data, differences in distance show how much ice has been lost.
One of the altimeters used was designed to be mounted on medium-altitude planes such as the C-130, while the other was designed for deployment on an unmanned, high-altitude aerial vehicle called the global hawk. Both were mounted on the plane and flights took place at an altitude of 10 kilometers, each making 2-kilometer scans that overlapped one another by 500 meters. This 500-meter-wide zone of data overlapped the area that was mapped in the spring. With the global hawk mounted, the researchers were able to double the amount of data collected.
Hofton says the UAV has been used just once on a mission in California, but will be a central part of upcoming missions. “That’s a future application (the global hawk). What’s cool is that it enables access to areas that are hard to get to,” said Hofton.
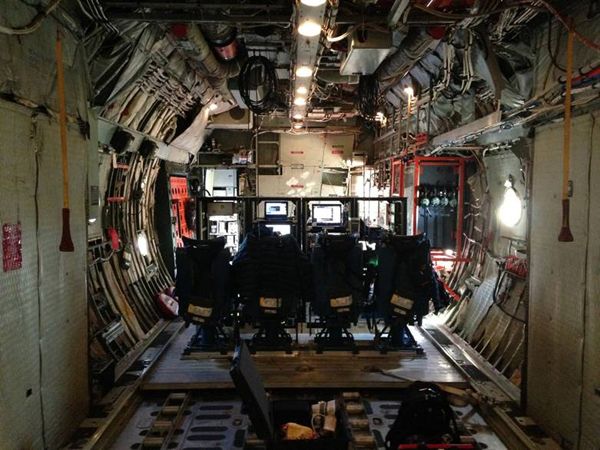
Interior of the plane showing the science station. The racks contain all computer and other equipment to control and monitor the two LVISs (Credit: The LVIS team)
One goal of the mission was to overlap the swaths mapped in the spring and achieve an image precision of 10 centimeters, a level required by NASA’s IceBridge mission. The team also followed the ground track of the European Space Agency’s CryoSat-2 satellite so that the data could be compared to those it collects. Hofton says flights were able to stay within 15 minutes of CryoSat-2’s track.
The benefits of the research are many. Comparing past and recently collected data will allow differences in Greenland’s ice to be discerned. The new data help to bridge the gap between NASA’s two IceSat satellites – the first is no longer monitoring and IceSat2 has yet to be launched. The data also serve as a reference point for other satellites.
“For future satellite systems, the more data we have now, the more data we have to compare to measurements,” said Hofton. “We can use them for calibration and also as a dataset to compare long-term elevation trends. It extends and enhances the elevation record of the ice sheet.”
Top image: LVIS elevation and slope data over the Qajuuttap Glacier in Southern Greenland from a 2012 mission (Credit: NASA Goddard Space Flight Center)


0 comments