
New California observatories improve forecasts of pineapple express storms
Scientists have long studied pineapple express storms that originate near the Hawaiian Islands and bring heavy rain or snow to the West Coast of the United States.
But a breakthrough in understanding these storms, which contain strong flows of atmospheric moisture, didn’t come until advancements in satellite technology made it clear that the powerful storms were being fed by long bands of water vapor circling the earth.
Known as “atmospheric rivers,” these bands can stretch from California all the way to Japan and can contain more water than the Amazon River, Earth’s largest by waterflow.
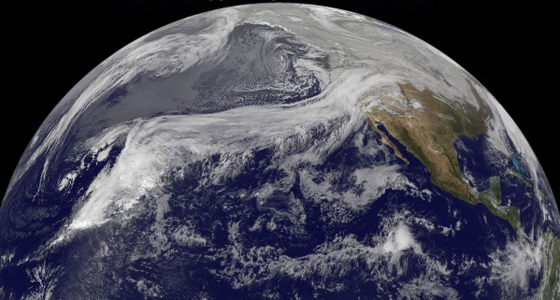
A satellite image of a Pineapple Express storm (Credit: NASA)
“It turns out that water vapor in the atmosphere has an unexpected tendency,” said Michael Dettinger, a research associate at the Scripps Institution of Oceanography. “It doesn’t move around in vast bubbles of moist air. About 90 to 95 percent of water vapor moving toward the north pole is actually moving in a half dozen bands covering about 5 percent of the area of the earth.”
In most cases, atmospheric rivers move from west to east, continually forming or disintegrating. One of Dettinger’s current projects is to find ways to improve forecasts of pineapple express storms caused after atmospheric rivers reach the West Coast of the U.S.
“When these rivers encounter western coasts or mountain ranges, they get lifted up, the water vapor condenses and strong rainfall events occur,” said Dettinger. “About 80 percent of damaging floods in California rivers are a result of these atmospheric river storms.”
New observatories
To improve current forecasting models, Dettinger, other researchers at the Scripps Institution and a team from the National Oceanic and Atmospheric Administration are deploying four land-based observatories.
“Others have used weather balloons that you send up twice a day,” said Dettinger. “It’s rare that you’d encounter the jets with those, and you wouldn’t know how wide one was if you did.”
Improving forecast capabilities may become more important as warmer temperatures become more prevalent.
")
The observatory’s S-Band Radar and disdrometer (Credit: Michael Dettinger)
“Warmer air can cause more water vapor to form,” said Dettinger. “Going into the projections of climate change in the 21st century, the number of atmospheric rivers that were arriving and the amount of water vapor they were carrying – in both cases – was increasing by 10 to 15 percent.”
Each new observatory has upward-looking radar at its core, acoustic sounders, specialized rain gauges and high-end GPS antennas, along with other instruments. The cost for each one runs around $1 million.
The radar is the most expensive component, able to measure in great detail the composition of winds, rain, sleet and snow at different levels in the atmosphere. Acoustic sounders on the units give an insight into storm turbulence, while the rain gauges measure rate and size of water droplets as they fall. The GPS antennas can record location and altitude down to a centimeter.
“We want to develop a growing understanding of these storms, to observe and track them in real time, and better predict where they’re going” said Dettinger. “Advances in technology have given us those new possibilities.”
New technology may have made the project possible, but partnerships helped get it off the ground.
“Some of us at Scripps and NOAA started talking a few years back about what a network could look like to monitor the storms,” said Dettinger.
Those conversations eventually led to a presentation to the flood management division of the California Department of Water Resources.
“We felt like it was our duty to make them aware of the options. In the end, they told us this kind of network was exactly what they were looking for,” said Dettinger. “The state agreed to provide half the funding and NOAA put up the other half.”
In addition to the four new observatories, which are being deployed in Bodega Bay, Eureka, Point Sur and Goleta, there are 100 other sites where smaller-scale measurements are taken.
“This is a really unique network. There’s nothing like it yet in the world,” said Dettinger. “California has a long tradition of devastating floods and this is the latest in a long history of dealing with them. We’re taking the latest science and ramping up our ability to manage these storms better.”
Image: A Global Data Assimilation System analysis shows an atmospheric river making landfall in 2009 (Credit: NASA)


0 comments