
Building a Profiling Buoy
Overview
Monitoring the yearly evolution of temperature is a critical component in many lake management and research programs due to its pronounced effects on aquatic chemistry and biology. Fisheries management, hydroelectric plants, selective withdrawal dams, and numerous aspects of aquatic and sediment research often depend on having temperature profiling data for a water body. This can be achieved using a NexSens Profiling Buoy.
Lake stratification develops seasonally as increasing solar radiation in the spring and summer heats up surface waters. Heat is quickly dissipated in the upper layers of water, and deeper waters remain cool. Because warmer water is significantly less dense than colder water, temperature-dependent density differences develop that prevent mixing and result in the formation of isolated layers of water. Due to the absence of water circulation between the layers, each strata of water develops its own distinct chemistry.
 Among the more common concerns is the depletion of oxygen in the deeper layers of stratified lakes. Dissolved oxygen declines sharply at the thermocline, or region of greatest temperature change. Below 7m depths, dissolved oxygen is insufficient to support most aquatic life. In the fall, the temperature and density gradient weakens as surface waters cool and sink. Mixing by wind and the sinking of cooler waters will eventually destroy the gradient, a process known as fall turnover. The resulting isothermal conditions restore water circulation and oxygen to the deeper layers of the lake.
T-Node Temperature String
The NexSens T-Node connectorized water temperature sensor features an integral digital sensor secured in a protective housing for underwater deployments down to 200 meters in fresh, brackish, or seawater. Each T-Node sensor is factory calibrated to +/-0.1 C for high-precision measurements. The sensors can be connected in-series using UW underwater cables and suspended vertically in a water column or horizontally along a stream or riverbed. Double o-ring seals ensure a waterproof sensor connection.
Temperature data is transmitted on a 1-wire temp string bus. In addition to the 1-wire bus, the T-Node offers pass-through signals for SDI-12 and RS-485, allowing the user to connect Nodes and other environmental measurement sensors along the string. This sensorBUS architecture has been designed so that researchers can easily build and customize multi-point temperature strings or more powerful environmental monitoring networks.
The T-Node sensors feature a plug-and-play interface to NexSens SDL500 submersible data loggers and offshore data buoys. Data collection options include standalone, radio, and cellular telemetry. NexSens iChart Software is a Windows-based program for interfacing both locally (direct-connect) and remotely (through telemetry) to an SDL500 data logger or network of data loggers. For connection to external data collection platforms, the T-Node sensor string can integrate with a NexSens controller for data output in SDI-12 or Modbus RTU.
sensorBUS Architecture
Developed to replace, expand and enhance centralized parallel wiring for prevailing analog and SDI-12 signal transmissions, sensorBUS technology simplifies the creation of environmental monitoring networks by combining several popular sensor interface types on a single 8-wire bus. sensorBUS is mainly used at the field level with interfacing capabilities to smart sensors that incorporate 1-wire temp string, RS-485 multi-drop or SDI-12 hardware/software connection. sensorBUS is the solution for linking multiple sensors using open, standardized technologies.
sensorBUS includes three industry standard digital interfaces (1-wire temp string, RS-485 multi-drop and SDI-12) along with both 12 and 5VDC power. 1-wire temp string is a multi-point communications network capable of supporting 128 temperature measurement nodes (sensors) over 200 meters. Data is transmitted and received on a single wire. RS-485 is a multi-point communications network capable of supporting hundreds of nodes (sensors) over a few thousand feet. The balanced 2-wire system is constructed with a twisted pair of conductors surrounded by a shield. SDI-12 is a serial data interface capable of supporting up to 10 sensors. The 3-wire system includes 12VDC, Ground and SDI data signals.
Data Logging and Telemetry
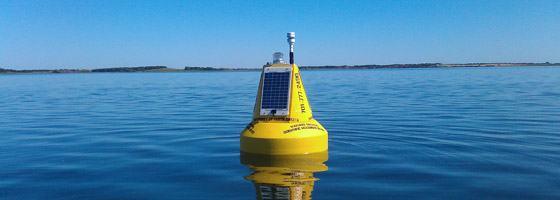
 A NexSens Profiling Buoy, based on the MB-300 Data Buoy platform, consists of a cross-linked polyethylene foam hull with a tough polymer skin coating. The round center housing accommodates the NexSens SDL500 submersible data loggers. Three NexSens 5-watt solar power packs are designed to mount to the top of the buoy to provide continuous power to the data logger and communications module.
Top and bottom mounted stainless steel eye-nuts accommodate moorings and lifting rigs for quick and easy deployment. The buoy is moored to the bottom via anchors, chain, and shackles. NexSens application engineers offer recommendations for deployment based on site conditions to ensure the systems will remain in location.
The SDL500 submersible data logging system consists of an iSIC data logger and communications module housed in a fully-submersible, 5 diameter round enclosure. The SDL500 can be outfitted with either a spread spectrum radio or cellular modem for real-time communication to shore.
Managing Data
Once the profiling buoy is set up, data is logged at a user-defined interval (minimum 1 minute). The user also sets the interval at which data is transmitted via radio or cellular telemetry. A typical monitoring system logs temperature data every 10 minutes and transmits data every 30 minutes.
Data is transmitted to a nearby (or remote) computer running iChart Software. iChart is a user-friendly software package that serves as the centralized interface and database for all incoming data. All data and sensor configuration settings are also stored in a single iChart database.
The software offers a unique historical report creation tool that can generate customized reports with data from all sensors in an iChart database. When creating a report, users can include specific information about the monitoring site, location, sensors, and project. After creation, reports can be converted to PDF, exported to Microsoft Excel, sent to interested parties via e-mail, uploaded to a web server, and more. The report template can also be saved and automatically generated, further automating the reporting process.
The NexSens WQData web datacenter is an optional service that automatically generates an online graphical interface for viewing, analyzing, and downloading data in real-time. This datacenter allows project members and stakeholders to remotely experience the lake stratification information as it occurs.
Rental Equipment and On-Site Services
While it often makes sense to purchase systems outright, there are many short-term temperature profiling projects that make it cost-prohibitive. NexSens Technology offers real-time Temperature Profiling Buoys with weekly and monthly rental rates to meet project requirements.
To ensure that customers can begin using their Temperature Profiling Systems as quickly and efficiently as possible, our application engineers are available for training and technical support, both by phone and in person. Our company offers both extensive field experience and a wide array of deployment hardware to facilitate seamless implementation of the project. Contact our application engineering team for your next temperature monitoring project.


0 comments