
Recording High-Water Marks Depends On GPS Data, Elevation
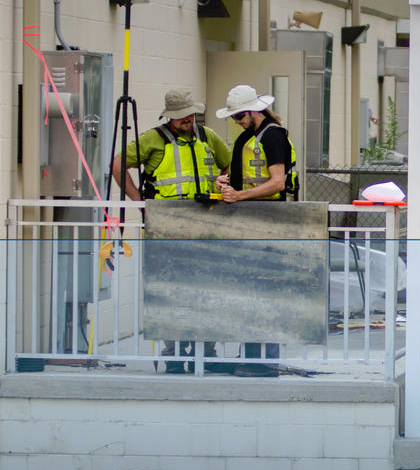
Hydrologic technicians use GPS equipment to survey a high-water mark outside of a flooded elementary school in Denham Springs, La., Aug. 28, 2016. (Credit: U.S. Geological Survey)
As water levels retreated after August flooding in southern Louisiana, crews with the U.S. Geological Survey (USGS) were on the ground trying to figure out just how high the waters got. It’s a simple question to ask, but finding the answer is a little more complex.
Their main concerns were high-water marks. These are pinpointed by searching for a line of debris, which floats aimlessly in rising flood waters, that remains on buildings, trees or other structures.
Even though it seems like a USGS scientist could easily find a high-water mark, pull out a measuring stick and determine its height, there’s much more to it than that. The process of establishing high-water marks takes some surveying, comparison with surroundings and precise GPS data.
When looking for a high-water mark on a building, USGS scientists’ efforts are sometimes thwarted by homeowners or business owners’ desire to clean up. When that happens, crews seek out alternatives like trees. But high-water marks are smaller on trees than on buildings, so another tree is typically sought out to confirm the high-water mark.
The next step after the high-water mark is measured is to log it into a system so the actual height of the water can be verified from the elevation of the ground. GPS surveying is used to identify the location of the high-water mark and then existing data on ground elevation are applied to establish the precise mark.
During the course of a flood response, USGS crews can collect the locations of thousands of high-water marks. Following the Louisiana floods, nearly 500 high-water marks were collected across nine parishes.

Daniel McCay and Chris Henry, USGS hydrologic technicians, use a level to draw a line on a high-water mark. (Credit: Jason Burton / U.S. Geological Survey)
The high-water mark effort following the Louisiana flooding was unusual because the marks were initially being flagged as quickly as possible without collecting GPS data. That was because there were several tropical depressions threatening the Louisiana coast at the time.
The goal at first was to get the high-water marks identified before a new storm could wash them away. But GPS data were applied to some of the sites, as USGS teams had quickly gotten a good number of high-water marks flagged.
The most important use for high-water marks is allowing for comparison and revision of flood risk maps. The maps help first responders and federal agencies identify areas that are likely to experience high water in the event of a 100-year flood. These maps show what areas are at risk to flood waters and what additional areas could come under threat if the flood is more severe.
High-water mark and GPS data also go into the USGS Flood Inundation Mapping effort, which is a map library showing where flooding may occur over a range of water levels in different communities. These maps are one factor used to determine where changes should take place in building codes, the placement of evacuation routes or other community planning efforts. They can also shorten response times for first-responders and aid environmental assessments.
To access the maps, check out the USGS Flood Inundation Mapper. It also shows historical flood information and potential loss estimates based on flood severity.
Top image: Hydrologic technicians use GPS equipment to survey a high-water mark outside of a flooded elementary school in Denham Springs, La., Aug. 28, 2016. (Credit: U.S. Geological Survey)
One Comment
Leave a Reply


W. Hunt
September 16, 2021 at 4:24 pm
Our survey teams recorded high water marks as directed by the NCDOT Hydraulics’ Unit Head in August 2021 after floods in Haywood & other counties in Western NC. We gathered this data after reviewing several videos on the USGS web site. Our sites were grade by us as 1 poor, 6 good, & 4 or 5 very good. We have coordinates, photos, filed notes , and physical transfer of all the high water marks we observed at structures destroyed or damage from the rain following H. Fred. Is there a place this data would be useful other than in our Hydraulics unit?