
Sodus Bay Water Quality Tracking Improves Bloom Predictions
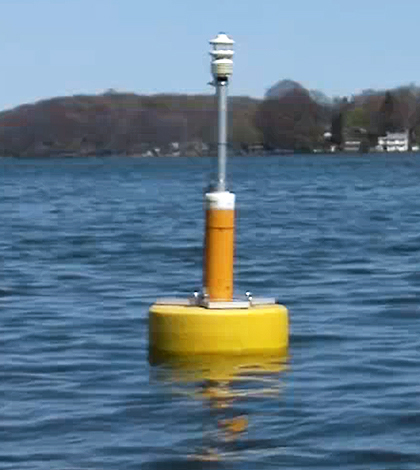
A data buoy into Lake Ontario’s Sodus Bay. (Credit: SUNY - College of Environmental Science and Forestry)
Just a few weeks before Labor Day in 2010, an algal bloom wreaked havoc on Sodus Bay water quality. The bloom also meant that businesses around the Lake Ontario bay felt a drop in visitors, and the economic losses were considerable.
The bloom was a wake-up call for many, including scientists at the State University of New York, who have monitored the bay ever since. This began in 2011 with random water sampling trips. But not long thereafter, researchers obtained data buoys to automate the work and share the data they gathered. These platforms have joined with others onshore to form a small network that keeps its eyes on the bay, segmenting water quality and weather changes as they happen.
“It was a big shock. And it became apparent what kind of impacts these algae blooms can have. So it wakened the community up,” said Edward Leroux, resident of Sodus Bay and volunteer with a team of scientists at the university’s College of Environmental Science and Forestry (SUNY – ESF). “We needed to find out how did it happen, why did it happen, is it going to happen again? Because once is a strange occurrence, but twice is a reputation.”
Luckily, there hasn’t been another bloom since 2011. But investigators are still keen to document Sodus Bay water quality because the real goal is to predict when future blooms might occur.
Getting to that point has meant a lot of data collection, much of which has been achieved by three NexSens MB-300 data buoys that are stationed throughout the bay. Two are equipped with weather stations, while all three have sensors for water quality. The north buoy, not far from where Sodus Bay opens to Lake Ontario, is equipped with instruments gauging temperature and conductivity.
The center buoy is one of the two tracking weather and has a string of NexSens T-Node Temperature Sensors that measure the bay’s temperature in a profile. An onboard water quality sonde keeps tabs on chlorophyll, colored dissolved organic matter and turbidity, among others parameters.

Mike Satchwell, left, of the State University of New York (SUNY) deploys a buoy into Lake Ontario’s Sodus Bay. (Credit: SUNY – College of Environmental Science and Forestry)
“On this south buoy particularly, we have a complete weather station,” said Mike Satchwell, senior research support specialist at SUNY-ESF. “So it’ll do air temperature, humidity, solar radiation, wind speed, wind direction, and then it also monitors for chlorophyll and the blue-green algal pigment phycocyanin.”
That pigment specifically is one parameter that investigators are focusing on to learn more about blue-green algae, also called cyanobacteria, so that blooms in Sodus Bay can be better predicted in the future. A spike in phycocyanin means a potential bloom may be on its way, Satchwell says.
In addition to data from the bay itself, an onshore weather station gathers other important measurements on what’s happening just above the water’s surface. It sits on LeRoy Island and is comprised of a solar-powered NexSens 3100-iSIC Data Logger and a weather sensor that gathers measurements of solar radiation, air temperature and wind speed and direction.
The station, like the buoys, is equipped with cellular telemetry that broadcasts data to scientists and the public in real time. These are accessible through the Great Lakes Research Consortium’s website or WQData LIVE.
Taking all of the data into consideration, the takeaways are somewhat mixed and indicate that more study is needed in the future.
“To date, data shows chlorophyll has dropped off while phosphorus levels vary up and down, and toxicity is down; but that doesn’t necessarily mean things are getting better,” said Greg Boyer, professor of chemistry at SUNY-ESF. “Phosphorus levels have to be in check and we have to be able to predict the toxicity levels.”
Funding for the data collection effort has come from a variety of sources, including the Great Lakes Observing System, New York Sea Grant and the U.S. Environmental Protection Agency’s Great Lakes Restoration Initiative.
Top image: A data buoy into Lake Ontario’s Sodus Bay. (Credit: SUNY – College of Environmental Science and Forestry)


0 comments