
California researcher’s plodding RV crosses nation sampling methane
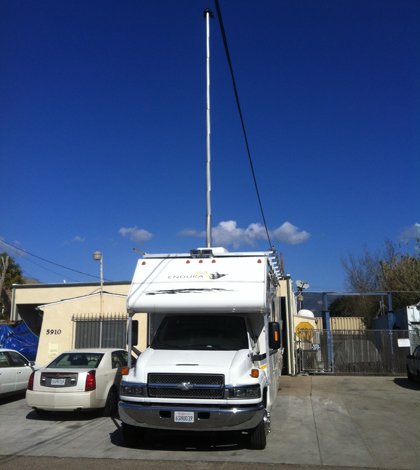
UC Santa Barbara researcher RV outfitted to sample methane on the road (Credit: Ira Leifer/UC Santa Barbara)
They’re cruising slowly down the highway in a big RV, with an air intake pipe hanging off the front. Don’t be fooled–this is not some leisure ride.
This cast of researchers is out to see the U.S. and sample its methane concentrations.
“I was the guy on the right lane driving at 40 miles an hour on the interstate,” said Ira Leifer, a researcher with the University of California Santa Barbara’s Marine Science Institute.
After years of studying methane, Leifer decided to turn the drive home from a 2010 research cruise on the Gulf of Mexico into a methane study. So, he outfitted a rented RV with a gas chromatograph and an air intake pipe to sample methane during the drive from Florida to California.
Data collected during the cruise showed higher levels of methane emissions than previously recorded, especially in areas of fossil fuel production in Texas.
Why study an odorless gas often associated with foul smells near cows and garbage dumps? Leifer said methane may have a greater effect on climate change in the short term than carbon dioxide.
“On a century time scale, yes, carbon dioxide will be a problem for my great grandchildren, if I have any,” he said. “On a political or human life time scale, methane will be a problem for me.”
Carbon dioxide already is in high concentrations in the atmosphere. There is so much of the gas that it will take a large amount entering the atmosphere quickly to drastically change the climate in the short term. “Methane on the other hand is nowhere near saturated spectrally, which means you add another molecule and it gets full impact,” Leifer said.
NASA reports that methane is 20 times more potent as a greenhouse gas than carbon dioxide. The difference is methane dissipates from the atmosphere more quickly if it isn’t replenished.
Leifer and his team wanted to investigate the sources of methane in the atmosphere. He was inspired to spearhead the cruise when he saw methane data from the space-based Scanning Imaging Absorption Spectrometer for Atmospheric Chartography. “I happened to notice that when you saw anomalies in maps of SCIAMACHY they tended to be centered in areas of fossil fuel production,” he said.
")
Air ram intake valve on the RV, shown crossing the Mississippi River (Credit: UCSB)
The team drove from Florida, through Louisiana, Texas, New Mexico and Arizona back to Los Angeles.
Rough roads meant the RV’s gas chromatograph had to be cushioned with bean bags, to dampen vibrations. “Much of America, especially parts of the Deep South do not have that good paved road feeling,” Leifer said. “It makes doing measurements from a moving vehicle difficult.”
Leifer had to drive slowly to capture as many data points as possible throughout the journey. The chromatograph sampled at 30 second intervals. In total, 6,600 methane samples were taken during the journey. When methane emissions spiked, the team took a detour to see where the methane was coming from.
Data collected showed areas near fossil fuel production in Texas had high methane emissions, just as SCIAMACHY displayed. Levels near natural seeps from California tar pits were also high. Both had methane concentrations up to 40 parts per million, while average emissions levels, from other areas on the cruise, were are about a twentieth of that number.
Large tracts of wetlands in Florida were only a tiny bit above average. Wetlands in Texas, on the other hand, showed much more significant methane emissions. But that was likely due to industrial activity nearby, Leifer said.
")
Methane data collected from Florida to California in 2010. Both the spatial average and the raw data show the highest levels were in the East Texas area, decreasing westward and eastward. (Credit: UCSB)
Leifer admits there is still a long way to go with his study. His data was collected on only one drive going one way across the U.S. He is now planning a new cruise with a new vehicle. He will improve his data collection methods and sample more areas.
Leifer is testing a new mobile gas analyzer lab built to his specifications in a toy-hauler recreational vehicle, which essentially has a garage in the back. The gas chromatograph was replaced with a cavity ring-down spectrometer that can sample at 10 hertz. The instrument is mounted with hydraulic dampers to ensure a smooth ride. A periscoping 50 foot mast can be raised when parked to collect samples.
On the next cruise across the nation, he will only determine where the methane is coming from and its specific sources. The new spectrometer should give him the capability to determine whether methane sampled is from a smokestack, wetland or another source.
Leifer also recently created an automobile-based greenhouse gas surveyor in a compact commuter car. He chose a sedan for this platform to minimize noise from the vacuum pump used for sampling. The vehicle mounted platform samples methane and carbon dioxide. An Airmar weather sensor is mounted on a mast tethered to the car’s roof.
So, if you see him slowly cruising on the highway or stopped on the side of the road, don’t scowl, just pass on the left.
Top image: UC Santa Barbara researcher RV outfitted to sample methane on the road (Credit: Ira Leifer/UC Santa Barbara)


0 comments