
With Rocky Mountain National Park sensor network, USGS captures HD picture of aquatic carbon
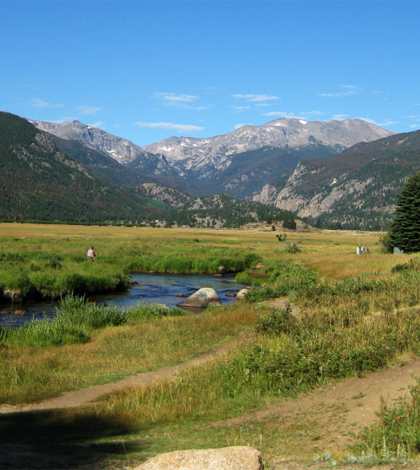
The Big Thompson River flows through Rocky Mountain National Park (Credit: USGS)
In September 2013, historic flooding around Colorado’s Front Range west of Denver destroyed homes, washed out roads and closed Rocky Mountain National Park for weeks. The closures cut off rescue workers and food aid from hard-hit mountain towns and separated scientists from streams and lakes within the park where they regularly collect water samples for long-term studies of water chemistry.
Though U.S. Geological Survey scientists couldn’t make it to the Big Thompson River where it runs through the park for weeks, a network of in-stream sensors captured the creek’s response to the flood in a way that wouldn’t have been possible through grab samples alone, even if the scientists had been able to access it.
The sensors in the Big Thompson River and the Loch Vale basin in Rocky Mountain National Park are showing scientists how carbon moves through aquatic systems with unprecedented clarity.
“The sensors allow us to collect data at much higher frequency than we can usually do when we just go out and collect manual grab samples,” said David Clow, a USGS research hydrologist in Denver. “We use those in-situ sensors to obtain a high-definition picture of carbon transport in streams.”
Getting that picture is no idle scientific curiosity. In 2007, Congress passed the Energy Independence and Security Act, which directed the USGS to calculate fluxes of carbon coming from natural and managed landscapes across the country.
To do that right, hydrologists need to know how concentrations of various forms of carbon, such as dissolved organic carbon and carbon dioxide, change season-to-season and even hour-to-hour. They do that with sensor stations that produce measurements every 15 minutes. The USGS has had instruments in the Big Thompson and Loch Vale basin for two years, and the results are revealing for the first time how aquatic carbon responds to events like floods and daily cycles in drivers like solar radiation.

Loch Vale in Rocky Mountain National Park (Credit: USGS)
Take, for example, a station on the Big Thompson, which includes a water level sensor and a fluorometer measuring dissolved organic matter. By converting those measurements into estimates of discharge and dissolved organic carbon, the researchers can see that organic carbon concentrations ramped up in the spring of 2013 as snowmelt flushed the soil of what had accumulated through the winter. Organic carbon continued to spike whenever warming periods sent additional pulses of snowmelt into the stream and discharge rose. Later in the summer, the relationship wasn’t as strong, as dissolved organic carbon levels stayed consistent despite daily fluctuations in flows. But when the water levels rose with the floods of September, the carbon concentrations went up with them.
The sensors have also revealed daily variations in dissolved carbon dioxide. The data shows a clear pattern of CO2 levels spiking at night and dropping during the day as the solar cycle shifts the balance between respiration and photosynthesis. Pairing the CO2 data with solar radiation data from another sensor shows the relationship is more complicated than just night and day. On Aug. 20, for example, one of the region’s characteristic summertime afternoon storms blew in and solar radiation levels dropped. Sensor data show the CO2 concentrations responded quickly with a quick bump as photosynthesis shut down.
In addition to events like floods and storms, the researchers are also interested in the effects of the Mountain pine beetle epidemic in the park. It’s killed off millions of acres of ponderosa pines, creating a rich supply of decaying organic matter that should wash into streams.
“A lot of our sites were installed to look at that specifically,” Clow said. “How does all the decaying organic matter change the fluxes of carbon in the streams?”
Clow, who has been conducting this kind of research for the past 20 years, said he’s only had the chance to work with these sensors for the past two years. They’re still relatively new and scientists are just scratching the surface of what they can do with them, he said. Meanwhile, they’ve been essential in capturing the variability that must be accounted for if the agency’s scientists are going to accurately calculate carbon fluxes.
But manual sampling certainly hasn’t been written out of the program. Though sensors are the only way to produce the high-frequency measurements they did have trouble collecting data throughout the alpine winter.
“We tried leaving them in the wintertime, and they didn’t break, but they did become encased in ice,” Clow said. “We do still need to go out and collect samples once in a while. We can’t just rely on the sensor data.”
Top image: The Big Thompson River flows through Rocky Mountain National Park (Credit: USGS)


0 comments