
Wavelet Analysis Monitors Phosphorus In Lake Erie’s Western Basin
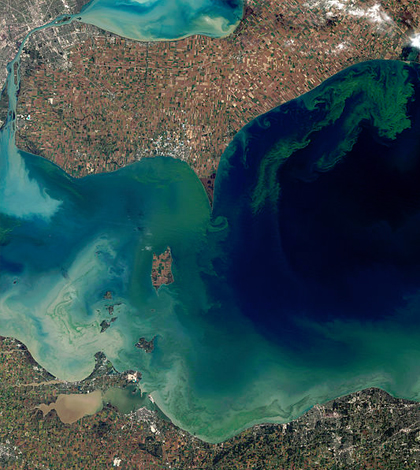
Algal bloom in Lake Erie, Oct. 5, 2011. (Credit: NASA)
Although many bodies of water near agriculture experience eutrophication, or excess nutrient loads due to fertilizer runoff, the problem has been especially severe for Lake Erie’s western basin. Not only is Lake Erie located in an area with very high agricultural output, it is also the shallowest and warmest of the Great Lakes, making it an excellent environment for algal growth.
However, Suresh Sharma, assistant professor in Civil and Environmental Engineering at Youngstown State University (YSU), has used matlab code developed by Torrance and Compo to understand the phosphorus loading pattern in Lake Erie. In particular, the YSU study has focused on Lake Erie’s western basin, as this is the area in Lake Erie with the highest phosphorus load. The YSU wavelet method is expected to aid best management practices and other phosphorus monitoring by adding the ability to characterize phosphorus loading patterns temporally and spatially, allowing detailed tracking of excessive phosphorus today and in the future.
Wavelet analysis was performed using long-term streamflow data from the U.S. Geological Survey, total and dissolved phosphorus load data from six Northern Ohio sampling stations near Lake Erie. The stations include information from six rivers: Cuyahoga, Grand, Maumee, Vermilion, Raisin and Sandusky.
Long-term, continuous phosphorus load data from these stations were used for wavelet analysis. Data from the six stations stretch back to the 1970s. In addition, streamflow and phosphorus load patterns with oceanic and atmospheric indices, including El Niño, were part of the study. Cross wavelet and wavelet coherent analysis were conducted and the relationship between climate indices and phosphorus loading was reported. YSU was able to coordinate all of this information into a new method which should be helpful for monitoring phosphorus loading in Lake Erie’s western basin for years to come.
“A wavelet is a mathematical tool,” Sharma explains. “It’s a process of decomposing a time series in time and space. We are looking at the wave amplitudes. Over time, since we have data as far back as the 70s, we begin to see patterns and we can relate them to phosphorus load.”

Wavelet analysis for Sandusky River. (Credit: Suresh Sharma)
River data came from an ambitious sampling project utilizing Heidelberg University and USGS resources. Data from rivers, sampled 3 or 4 times per day for total phosphorus and dissolved phosphorus as part of Heidelberg’s tributary monitoring program, were used. The USGS also provided streamflow records, which were captured continuously. The data was put into MATLAB code by YSU researchers.
“Then we used the LOADEST regression tool. In some cases we were missing a data point or two but we were able to use an interpolation technique to fill in the missing information,” Sharma says. Using all the information, Sharma and other researchers were able to obtain continuous phosphorus data filled in by LOADEST.
Sharma explains, “We were basically attempting to understand the phosphorus trends we saw in the western basin of Lake Erie by using mathematical tools.”
One or two people typically handle the analysis, he indicates. But one YSU graduate student, Naba Subedi, Sharma specifically singles out as having done a great deal of wavelet analysis for the study.
“Lake Erie has a long history of being high in phosphorus,” Sharma says. “This has been true since the 1960s. The total phosphorus level in 1968 was 28,000 metric tons, which is much higher than it is now. Land management efforts to reduce phosphorus loads are having an effect. Now, 11,000 metric tons of total phosphorus is average, though still high. The story is not the same for dissolved phosphorus, which has still been getting higher.”
The dissolved phosphorus is much more effective at encouraging algal blooms than particulate phosphorus, but it is a relatively small portion of the phosphorus in Lake Erie’s western basin. Most of the phosphorus is particulate phosphorus from agriculture and sediment collection.
The severity of algal blooms is not only related to the amount of phosphorus but also to the amount of rainfall. Heavy rainfall culminating in a wet year also increases algal blooms. Heavy rainfall tends to cause more agricultural runoff. Wetter conditions are simply preferred by algae.
El Niño and La Niña events, therefore, were also considered in the data and incorporated into the wavelet analysis study, as these weather phenomena can have dramatic effects on annual rainfall. “We can predict El Niño and La Niña effects using our cross wavelet and wavelet coherent analysis,” Sharma says.
Other factors include the distribution of agriculture around Lake Erie. The Miami and Sandusky Rivers’ land is 75 to 80 percent agricultural, leading to more phosphorus runoff from those areas, whereas the Cuyahoga River area near Cleveland is mostly urban and produces considerably less agricultural runoff. The Grand River, on the other hand, is considered to be a mixed-water dataset, as a significant portion of the land is forested.
Sharma and his team, like many other researchers, are trying to understand the high phosphorus levels of Lake Erie.
“Lake Erie is a water source for many, so we can’t avoid the effects of rainfall but certainly the crops which need less fertilizer can be planted. However, we can establish bioenergy crops which needs less fertilizer. We could use marginal land that surrounds farming fields and use bioenergy crops which need less fertilizer,” he says. “Not only could those bioenergy plants reduce phosphorus, we may be able to use them as biofuel, which would decrease our energy independence.”
Sharma has had some interesting results in the course of his wavelet research. “It was interesting to find that the base flow had such a large role and that the dissolved phosphorus piece was such an important piece relative to the total phosphorus,” Sharma says. “Spring rainfall and agricultural land also proved to be major factors in what we saw in the Lake Erie western basin results.”
Top image: Algal bloom in Lake Erie, Oct. 5, 2011. (Credit: NASA)


0 comments