
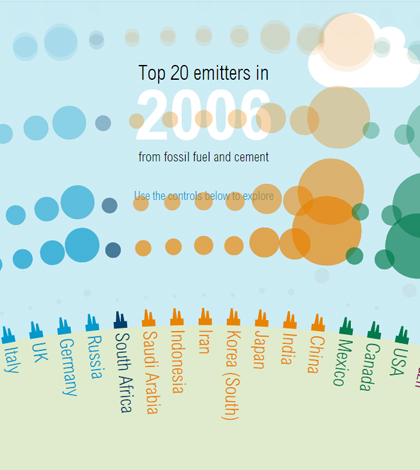
Web tool illustrates history of top 20 carbon-emitting nations
An interactive visualization of carbon dioxide emissions is available on The Guardian’s website. The newspaper launched the tool ahead of international climate talks in 2014.
Users of the “Carbon emissions: past, present and future” tool can click around to view information on the world’s top 20 carbon dioxide emitters. The tool also displays a timeline so that visitors can see how emissions have fluctuated since the beginning of the Industrial Revolution.
Data for the tool come from the International Panel on Climate Change and the World Resources Institute. By plugging in past figures, the interactive visualization also provides a prediction of what emissions might be in the future.
Top image: The history of the world’s top 20 CO2 emitters is illustrated in a new online tool. (Credit: The Guardian)


0 comments