
Cryosat satellite: Arctic ice is thinning
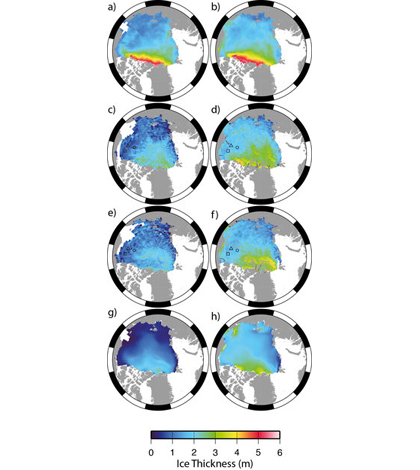
ICESat, CryoSat and PIOMAS sea ice thickness measurements in the Arctic. Figure (a) shows the 2003–07 average ICESat ice thickness for October/November and (b) the 2004–08 average for February/March. Figures (c) to (f) are measurements based on CryoSat data, for October/November 2010 (c), February/March 2011 (d), October/November 2011 (e) and February/March 2012 (f). The final two figures are based on PIOMAS measurements for October/November 2011 (g) and February/March 2012 (h).
Data from the European Space Agency’s Cryosat satellite confirm that Arctic ice has decreased markedly between 2003 and 2012, according to a release. The greatest decline in ice has occurred in summer months, with the last six summers seeing the thinnest ice in 30 years.
The Cryosat satellite has a high-resolution altimeter which allows it to give a more accurate picture of ice loss by measuring ice thickness instead of just surface area. Cryosat has documented a 36 percent decrease in Arctic ice during autumn months and a 9 percent decrease in winter time.
The findings were confirmed with ground and airborne measurements taken in the region and by comparing data to those collected by NASA’s Operation IceBridge, a mission that observes Earth’s polar ice.
Image: ICESat, CryoSat and PIOMAS sea ice thickness measurements in the Arctic. Figure (a) shows the 2003–07 average ICESat ice thickness for October/November and (b) the 2004–08 average for February/March. Figures (c) to (f) are measurements based on CryoSat data, for October/November 2010 (c), February/March 2011 (d), October/November 2011 (e) and February/March 2012 (f). The final two figures are based on PIOMAS measurements for October/November 2011 (g) and February/March 2012 (h).


0 comments