
USGS map shows county by county climate predictions
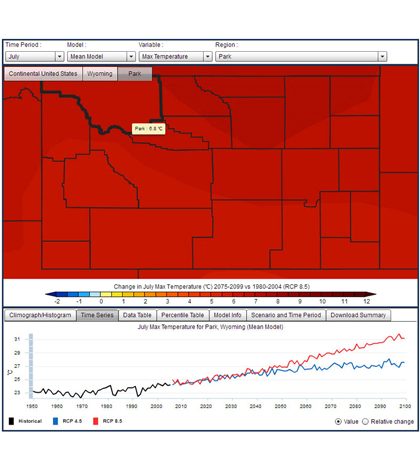
Example of the web application displaying changes in maximum summer (July) temperature for Park County, Wyo. (Credit: USGS)
The U.S. Geological Survey and Oregon State University have combined efforts to create a web tool showing county by county temperature and precipitation projections, according to a USGS release.
The web tool incorporates 33 climate models. International Panel on Climate Change assessment data was also factored into the predictive maps. NASA scientists scaled the models down for individual counties.
Users simply select their state of choice into the web tool via a drop down menu and click on a county to observe historical and predicted climate data.
The project was designed and led by USGS scientists Jay Adler and Steve Hostetler.
Adler said the tool could be valuable for farmers and land managers who need to plan their year to year land management.
Image: Example of the web application displaying changes in maximum summer (July) temperature for Park County, Wyo. (Credit: USGS)


0 comments