
Monitoring station helps track Columbia River’s effects on its estuary
Each summer, an ocean current pushes water from deep in the Pacific up to the surface waters on the Oregon coast. This upwelling of low-oxygen, high-carbon dioxide water contributes to hypoxia and ocean acidification on the coast and in the Columbia River estuary, which gets a pulse on every tide.
The severity of those problems depends on the chemical and biological characteristics of the estuary, according to Joseph Needoba, an assistant professor with Oregon Health and Science University’s division of environmental and biomolecular systems.
“If you have more primary production than you have respiration, then you’re effectively adding oxygen to the water and removing carbon dioxide, and that makes both the hypoxia and acidification better,” Needoba said. “But if it’s the opposite—if you have more respiration on a 24-hour period than you have primary production—then you’re actually making the problem worse.”
Which of these scenarios is unfolding depends on the material that the Columbia River delivers to the estuary. The chemical fluxes that occur in water as it flows from rivers to estuaries to the coastal ocean are among the research interests of the Beaverton, Ore.-based Center for Coastal Margin Observation and Prediction, where Needoba is an affiliate scientist. The center is a collaboration of several university and industry partners with core funding from the National Science Foundation.
“Our approach for those types of questions has been to use the observatory system where we get these high-resolution measurements of many of these biogeochemical parameters,” Needoba said. “Not just nutrients, but chlorophyll concentration, and if possible, estimates of primary production and respiration.”
Accordingly, a system of sensors launched by the center has been continuously recording turbidity, temperature, chlorophyll, dissolved oxygen, colored dissolved organic matter and nitrate levels in the Columbia River since June 2009. The data (which is available live here) is shedding new light on what’s going on in the river, as well as what that means for the estuary and Oregon’s coastal water.
Plankton ecology
The data so far have given researchers new insight into the river’s plankton blooms. Though scientists already knew the river had periods of high chlorophyll concentrations, the sensors have helped paint a clearer picture of recurring, seasonal blooms.
“There have been studies dating back decades that show that diatoms are there and chlorophyll is high during these times of low river discharge,” said Michelle Maier, an Oregon Health and Science University doctoral student who studies the Columbia’s plankton ecology. “But, from the sensors, we can see exactly when the timing of the blooms are and the magnitude of the blooms.”
Maier’s advisor, Tawnya Peterson, is an assistant professor in the university’s division of environmental and biomolecular systems and a principle investigator on the center’s Columbia monitoring project.
The sensors have also helped Maier determine the species composition of the river’s plankton. Targeting sampling trips during the times when data show that chlorophyll levels are high helps make sure that no effort is wasted by heading out to the river when the plankton aren’t blooming.
Uncovering which phytoplankton species make up the river’s seasonal blooms could play a role in calculating how much carbon the river is sending to the estuary. For example, the Asterionella diatoms that make up the spring bloom are particularly susceptible to a parasitic infection. Those infections could have important implications for whether the carbon bound up in the spring bloom flows out to the estuary or is integrated in the river’s foodweb.
Maier is looking into is how much of this Asterionella carbon is being taken into the parasites and then being eaten by zooplankton. “Knowing the species composition and how many infections are occurring might give you a good idea of how much of the diatom carbon is going into the foodweb in the river versus being flushed out into the estuary,” she said.
Ecosystem metabolism
A calculation of the Columbia’s net ecosystem metabolism is a key measurement in determining the effects of the river’s payload on the estuary’s hypoxia issues. The method requires adding up the change in oxygen over a 24-hour period. During daylight, some increase in oxygen is attributed to primary production, and oxygen decreases at night are attributed that to respiration. This has shown that, during its spring, summer and fall plankton blooms, the Columbia is producing more carbon than is being respired. In the winter, it’s respiring more carbon that it’s producing.
“That has real implications for calculating carbon fluxes in the coastal zone,” Needoba said. “If the river produces more carbon than it’s consuming, the fate of that carbon is to be respired in the coastal ocean. It’s essentially what contributes to making the hypoxia conditions worse, if there was a big load of organic carbon coming down the river.”
But there’s still work to do to figure out whether that’s the case. One matter left to consider is timing. The extra carbon from the river’s large blooms will only exacerbate the issues brought on by the upwelling ocean water if the two events happen at around the same time.
“If they do, you end up with these worse conditions. If they don’t, then nothing happens. It changes from year to year,” Needoba said. “We’re hoping, over time, that we’re going to start capturing enough of those dynamics to get a better handle on what’s really happening in the Columbia River estuary.”
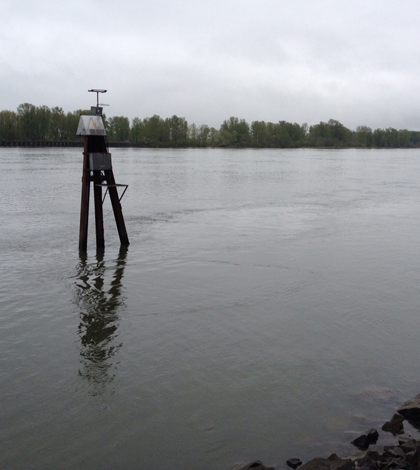
Top image: The Center for Coastal Margin Observation and Prediction’s Land/Ocean Biogeochemical Observatory sensor platform in the Columbia River (Credit: Michelle Maier)


0 comments