
NOAA weather map shows July heat wave
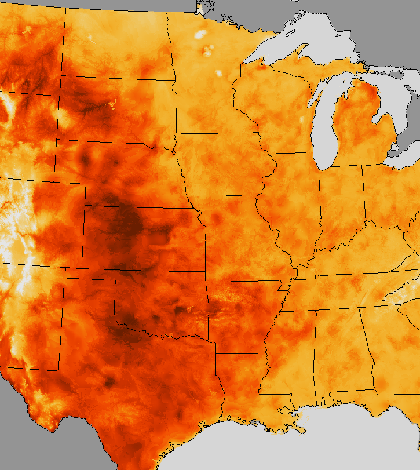
A map of the July 2013 heat wave (Credit: NOAA)
The National Oceanic and Atmospheric Administration has released a map showing the heat wave from July 10 through July 19. The map shows temperatures surpassing 107 degrees Fahrenheit in some states.
Parts of California and Arizona were hit hard by the heat, and the high temperatures caused a usage record that taxed New York City’s energy grid. They city of Boston experienced a new high of 99 degrees and a nuclear power plant near Cape Cod was forced to cut output as the Cape’s waters were too warm to cool its reactor.
The data shown are from NOAA’s real-time mesoscale analysis. The maximum air temperatures shown on the map don’t include the heat index, which would combine air temperatures with relative humidity to guess how hot the weather felt in some places.
")
A map of the July 2013 heat wave. Click for large version. (Credit: NOAA)


0 comments