
Q&A with Matt Cohen: Tracking elements through ecosystems in Florida’s springs
Matt Cohen, an associate professor with the University of Florida’s School of Forest Resources and Conservation, works with sensor systems to investigate the nutrient and chemical dynamics of Florida’s spring-fed rivers. The Environmental Monitor recently spoke with Cohen about his National Science Foundation-funded work on using Redfield’s ratio and high-resolution data from water quality sensors to understand how elements cycle through ecosystems.
Environmental Monitor: What is Redfield’s ratio?
Matt Cohen: Redfield’s ratio describes how different elements are assembled inside organisms. It’s often reported as a ratio of carbon to nitrogen to phosphorous. It varies modestly from plant to plant particularly between algae and vascular plants, but it varies very little in animals. It’s remarkably consistent across organisms and thus useful for understanding how organisms affect element cycling in the Earth system.
We can measure this ratio in organisms, but we’ve never really been able to measure that ratio in ecosystems to see how organisms affect the way that elements are transported and transformed through ecosystems. That is what sensors now are allowing us to do. We can basically observe the ecosystem-scale Redfield ratio, more or less in real time.
")
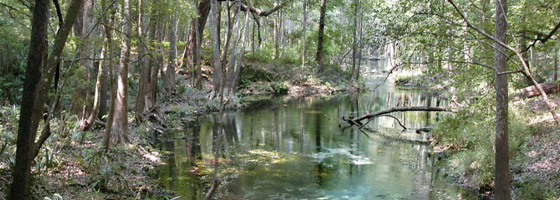
High vascular plant biomass in the Silver River (Credit: Larry V. Korhnak)
EM: Why is that an important thing to know?
MC: Understanding how elements are coupled to one another at different scales, at the scale of the individual organism all the way up to the scale of the biosphere, is a pressing question. Understanding global carbon cycles, for example, is obviously important for mitigating and predicting climate change. But you can’t understand the global carbon cycle all that well until you start understanding the global nitrogen cycle, because they’re coupled with one another. The same is true for phosphorous, and arguably for all of the elements that organisms require, and also therefore affect environmental concentrations.
But it’s also really important to understand things like the effects of nutrient pollution. We want to be able to say at what point is there too much phosphorous or nitrogen in a river or lake or an estuary. And our argument is that by understanding how those nutrients affect the ecosystem behavior, how they affect metabolism, we can say that with much more scientific rigor. It has applications answering questions like: When is there too much phosphorous in a lake, river or estuary? When is there much nitrogen? How do we predict whether a lake or a stream is healthy or not, and whether it’s improving or not in response to our management efforts?
EM: How are sensors helping?
MC: Dissolved oxygen sensors, which have been around for a long time, are widely used to help us understand riverine carbon dynamics. The more recent breakthroughs are in the sensing of nutrients. Nitrate sensors let us understand nitrogen dynamics and phosphate sensors let us peer into the somewhat more complicated phosphorus dynamics. And now, by putting all three of them together, we can start to delve into how they are coupled.
The sensors, in my mind, are opening up doors to understanding the fundamentals of ecosystems, but also making predictions about how they work, which is really the foundation of ecosystem management and restoration.

A) Multi-parameter sonde for dissolved oxygen and specific conductance, B) SUNA for nitrate, C) Cycle-PO4 for phosphate. Vertical dashed lines denote midnight of each deployment day.
EM: Why do you work in rivers, and how do you go about collecting data there?
MC: Rivers are important model systems for ecological systems in general. The main reason is that flow carries all of the byproducts of the processes that control elements downstream. Everything that happens in the ecosystem, writes a signal into the chemistry of the water as it flows by. And if we measure the water downstream at a time scale consistent with those processes, we can ask quantitative questions about how those elements are coupled.
We work in North Florida’s springs. This is actually the world’s highest density of artesian springs. It’s an extraordinary resource, ecologically, aesthetically, and culturally. These rivers that we study, they are large–they’d be a medium sized river in many basins–and they come out of the ground at a point, and then they flow downstream. And they come out of the ground with some amazing properties. First they are astonishingly clear, perhaps the clearest freshwater in nature. And, crucially, their temperature flow and chemistry are, basically, constant. So they are really well behaved. We put our sensors just downstream, four or five miles. And we know, because the upstream flow is effectively constant in every way, any variation we measure downstream can be attributed to ecosystem processes in that little stretch of river.
")
High water clarity at Ichetucknee Head Spring (Credit: Larry V. Korhnak)
So, what we do is just track what happens to the water chemistry over a 24-hour cycle for many days, usually 8 to ten days at a time, but we have a more-or-less continuous data set for 2 years in one river. We put out sensors to measure dissolved oxygen and temperature, conductivity, pH. We have a UV nitrate analyzer made by a company called Satlantic that we set up to take measurements at 15-minute resolution. And more recently we’ve been working with a sensor made by a company called WET Labs out of Oregon that does phosphate.
EM: Are you to the point where you can connect the data that you’re getting back to Redfield’s ratio?
MC: We are. At least with these rivers, we understand the things that control nutrient variation over the course of a day well enough to make a prediction about the whole ecosystem’s Redfield ratio, which is important.
Our rivers have many different types of plants. There is algae that grows in the water. There are plants that are rooted to the river bottom. Using our technique it’s increasingly possible to divide the amount of primary production between those two. That’s never been possible before, but you can use Redfield’s ratio because plants and algae have systematically different ratios. In other words, we can use the sensor signal at the ecosystem scale to say, ‘Well, algae are doing most of the production,’ or, ‘Plants are doing most of the production.’ That’s an important step because we want to understand the relative availability of food for animals, and to detect changes in the relative abundance of plants and algae with the variety of human stressors.
It also allows us to understand whether a river is saturated with respect to its nutrient supply. Plants need nutrients to grow, but at some point that demand is satisfied. And at that point, adding more nutrients may have no additional effect. Sensors are allowing us to hone in on that question too, which is obviously really important from a water quality perspective, because we want to make sure that if systems are nutrient limited that we keep them that way.
We are at the point now where I think that we can do it. The particulars of it are actually not totally straightforward because both nitrogen and phosphorous are retained by other processes – for example denitrification for nitrogen retention and mineral interactions for phosphorus. But it turns out that we can estimate those pretty effectively with other sensor measurements, and when we do, we can adjust the nutrient signal we see for only the part that’s due to the plants. We can isolate that part and then we can say something pretty precise about Redfield’s ratio at the ecosystem scale. And we believe that better understanding makes us better managers and stewards of these and other ecosystems.


0 comments