Atlantic Ocean Overturning Circulation Weakening with Warming

(Credit: Inter-governmental Panel on Climate Change, https://www.eurekalert.org/multimedia/pub/167397.php?from=390188)
If you’ve visited both Newfoundland and the UK, you’ve experienced the practical effect that the Atlantic Meridional Overturning Circulation (AMOC) has on weather. As the warmer currents in the Atlantic Ocean move north with the Gulf Stream following the United States coast, they cool and sink into deeper regions of the ocean. Eventually making their way south, pushing past the UK and eventually heading toward Antarctica near the ocean’s floor.
However, this circulation cycle does a lot more than bring warmer (or colder) weather. The weather is a consequence of the way the AMOC moves heat around the globe, one of its key functions. The AMOC also churns nutrients into ocean waters as it moves, and helps suck atmospheric carbon dioxide into the ocean.
New research from Woods Hole Oceanographic Institution (WHOI) and University College London (UCL) reveal that AMOC is currently weaker than it has been in the past 1,600 years, and hasn’t reached peak strength since the mid-1800s. If it continues to lose strength, it may contribute to more rapid rises in sea level along the East Coast of the US, and disrupt weather patterns across a broad portion of the Northern Hemisphere.
Analyzing the history of AMOC
Dr. Delia Oppo, co-author of the study and a senior scientist with WHOI, corresponded with EM on behalf of herself and lead author Dr. David Thornalley, a WHOI adjunct and senior lecturer at UCL, about the research and why AMOC is so important to the global system of ocean circulation.
“AMOC redistributes heat, salt, nutrients and carbon,” explains Dr. Oppo. “For example, the heat carried northward near the surface by the AMOC keeps western Europe relatively warm compared to similar latitudes of eastern North America.”
This work represents the first comprehensive analysis of sediment records from the world’s oceans. To explore past Atlantic circulation, the team investigated the size of the grains of sediment deep-sea currents deposited first.

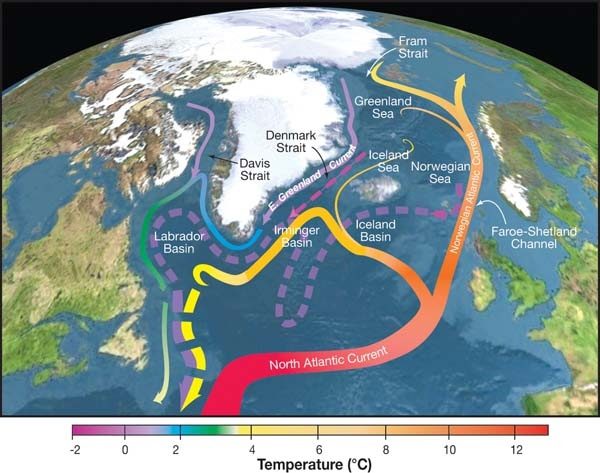
Topographic map of the Nordic Seas and subpolar basins with schematic circulation of surface currents (solid curves) and deep currents (dashed curves) that form a portion of the Atlantic meridional overturning circulation. Colors of curves indicate approximate temperatures. (Credit: By R. Curry, Woods Hole Oceanographic Institution/Science/USGCRP. [CC BY 3.0 (https://creativecommons.org/licenses/by/3.0)], via Wikimedia Commons)
Collecting and analyzing sediment grains is a long process. First, someone must collect the sediment cores. The team was fortunate in that co-author Lloyd Keigwin had collected sediment cores from previous work, which were stored in the WHOI core repository.
“To get grain size, we sample the core in small pieces, wash the sediment through a sieve to collect the fine fraction (<63 microns),” Dr. Oppo describes. “That fine fraction is processed, and in our case run on a ‘Coulter Counter.’ ”
Grain size is a proxy for current strength because it takes force to move solids around and deposit them somewhere else. Stronger currents generate more energy, which puts larger grains of sediment into motion. Furthermore, Dr. Oppo explains that when the sediment resettles there is some size sorting with larger particles preferentially settling—which means that the smaller particles don’t resettle as quickly and are carried away in the current.
Some of the particles even helped the team determine a more accurate timeline.
“This is the first study I’ve been involved in where spheroidal carbonaceous particles (SCP) were used to confirm the age of the marine sediment cores—the SCPs are derived from high-temperature combustion of fossil fuels, and so are a marker for fossil fuel burning,” remarks Dr. Oppo. “This is Neil Rose’s expertise, also a coauthor.”
The team then reconstructed ocean temperatures near the surface in areas where AMOC and its strength influence temperature. The comprehensive analysis from this research presents a longer-term view of the weakening of the current, which started as the centuries of colder climate during the Little Ice Age wound down, in around 1850. As temperatures climbed, arctic ice and glaciers melted and introduced large amounts of fresh water into the Atlantic Ocean; this diluted seawater at the ocean’s surface, slowing the AMOC by hampering the now-lighter, was from sinking into deeper regions.
A warming climate prompts other questions
Although some fluctuations in the global ocean circulation system are natural, to some extent they are probably caused by human-made climate change. Other research in the same issue of Nature confirms this trend.
“Fluctuations in the global ocean circulation system are natural,” states Dr. Oppo. “We think the beginning of the decline we see in our records is also natural (at the end of the Little Ice Age). We cannot rule out that the changes late in the 20th century are due to human-made climate change, and it seems likely (as also discussed in the Caesar paper in the same issue as ours).”
If the AMOC system keeps getting weaker, it could cause more rapid increases in sea levels on the U.S. East Coast and disrupt weather patterns—and it seems likely that it will continue to weaken as the climate warms.

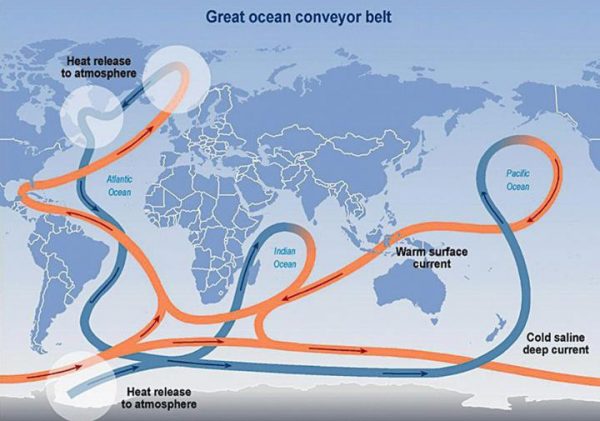
When it comes to regulating global climate, the circulation of the Atlantic Ocean plays a key role. The constantly moving system of deep-water circulation, sometimes referred to as the Global Ocean Conveyor Belt, sends warm, salty Gulf Stream water to the North Atlantic where it releases heat to the atmosphere and warms Western Europe. The cooler water then sinks to great depths and travels all the way to Antarctica and eventually circulates back up to the Gulf Stream. (Credit: Intergovernmental Panel on Climate Change, https://www.eurekalert.org/multimedia/pub/167397.php?from=390188)
“Models predict it will continue to decline as a result of global warming, which accelerates the hydrologic cycle (more fresh water from rivers entering the Arctic) and also causes more sea ice melt and glaciers to melt,” clarifies Dr. Oppo. “This freshening is predicted to continue to weaken the AMOC.”
Although these results are fascinating, and to some extent worrisome, the team emphasizes that our understanding of the AMOC and fluctuations in it is still nascent. As changes in the AMOC that occurred in the past might surprise us, so might changes in the future.
“We would like to understand whether the weak AMOC of the last ~150 years is really unique to the current interglacial period (the Holocene),” adds Dr. Oppo. “We intend to study other cold intervals during the last several thousand years, to see if there are equivalent decreases at the end of the cold periods. We are especially curious to see if the continued decline we see in the 20th century is unique to the industrial era. We also want to understand whether all AMOC components (Labrador Sea Water and the two Nordic Sea Overflows) all operate together or if there are differences in timing, and is that relationship among the components the same before and after the Little Ice Age.”
All of these complex questions are further obscured by the inherent difficulty of measuring and analyzing the past.
“One thing that I like to point out is how difficult it is to reconstruct climate for the past—before we have direct measurements from instruments,” explains Dr. Oppo. “We were really lucky in this study to have access to a sediment core where sediment accumulated so rapidly that we could compare our data to instrumental measurements, giving us confidence in our interpretations. Even so, we needed to use a model to assess how changes occurring at the single point of our sediment core reflects changes occurring on much greater spatial scales (such as that of the AMOC).”
What else is next for the team? Dr. Oppo thinks they may be determining why there are differences in the results they get compared with other, similar results.
“We estimate about 15% overall weakening since the end of the LIA,” describes Dr. Oppo. “Whereas our study suggests that at least half of that decrease occurred before 1950, a study in the same issue of Nature (Caesar et al.) suggests that more of it occurred after 1950. This difference underscores that researchers use a range of proxies to extend instrumental observations. The big picture is that they are telling us the same thing: there is a convergence of evidence that the AMOC is weaker now than it was during the LIA. Zooming in, it will be important for us to understand why there are differences; are our proxies affected by non-AMOC related influences, or are our proxies recording different aspects of the AMOC, or both?”
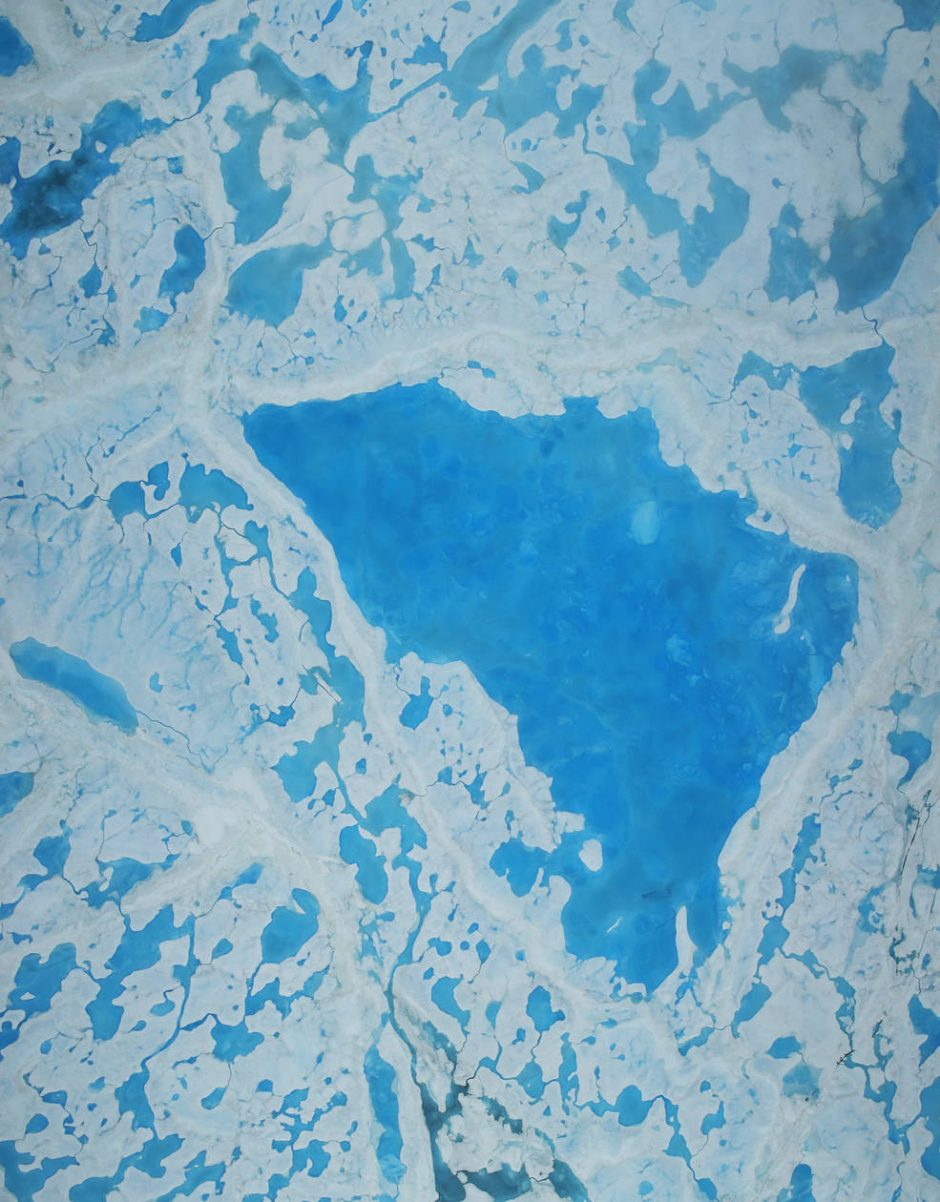
Top image: A large pool of melt water over sea ice, as seen from an Operation IceBridge flight over the Beaufort Sea on July 14, 2016. During this summer campaign, IceBridge will map the extent, frequency and depth of melt ponds like these to help scientists forecast the Arctic sea ice yearly minimum extent in September. (Credit: By NASA Goddard Space Flight Center from Greenbelt, MD, USA (NASA Science Flights Target Melting Arctic Sea Ice) [CC BY 2.0 (https://creativecommons.org/licenses/by/2.0) or Public domain], via Wikimedia Commons)


0 comments