Keeping TABS on the Texas Gulf Coast
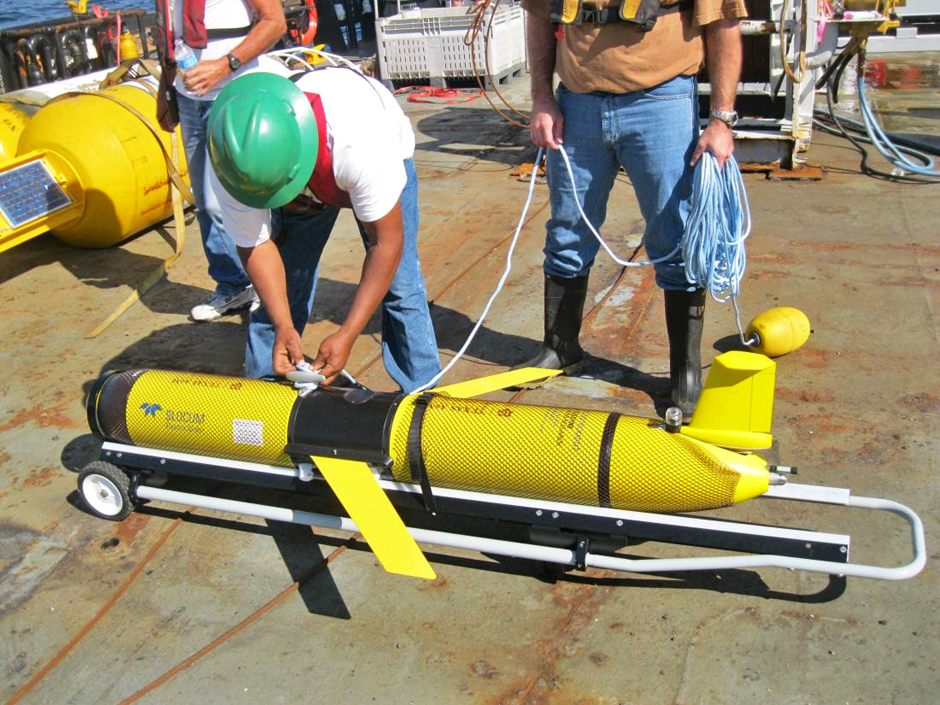 A GERG Teledyne Slocum Buoyancy Glider. (Image: via source)
From extreme weather such as Hurricane Harvey to spills and other accidents, the Gulf Coast of Texas is no stranger to dangerous situations. This is where the data provided by the Texas Automated Buoy System (TABS) comes into the picture.
Among the nation’s most successful and longest-running coastal ocean-observing systems at the state level, the TABS real-time oceanographic buoy system monitors currents, waves, salinity, winds, and other parameters. Dr. Anthony Knap, director of Geochemical Environmental Research Group (GERG) and a Professor of Oceanography at Texas A&M University, spoke to EM about working with TABS.
“TABS has been running now for 24 years,” explains Dr. Knap. “I came to Texas A&M six years ago with a background in taking long-term, sustained measurements in the ocean, and being able to show the importance of that sort of effort.”
Generally, scientists strategies differ, from shipboard measurements poking a hole in the ocean by putting a wire down with various bottles on it and collecting the discrete samples at monitoring locations in specific places based on physics, biology, or other factors, to repeat measurements at the same spot over time either with ships or other remote tools such as buoys, gliders, etc.
Dr. Knap elaborates on the value of monitoring parameters and over time, in the same locations.
“It’s a strategy that provides you with temporal changes, an incredibly powerful tool for trying to understand the ocean. There is a massive amount of variability in the ocean due to eddies, which are basically oceanographic storms—just as you have things like hurricanes and lows in the atmosphere or other forms of ocean currents.”
Returning to the same spot to monitor over time provides a better sense of how the ocean is changing because it reduces variability and deepens knowledge of ocean mechanics.
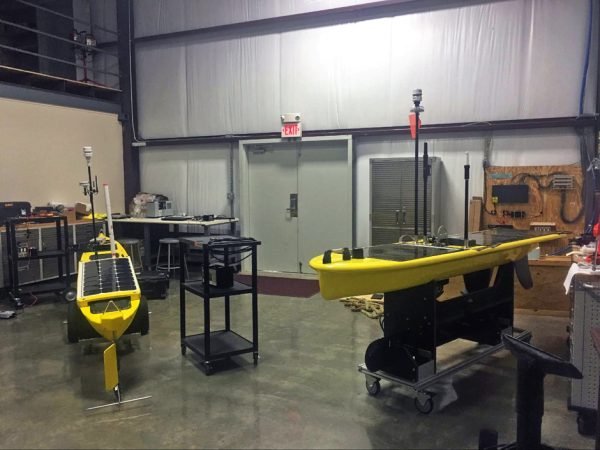
Two of GERG’s wave powered surface vehicles Autonaut
and a Liquid Robotics wave-glider. (Image: via source)
“The location of the TABS sites were chosen very carefully, because they represent many of the physical oceanographic parameters that change on the Texas coast due to its bathymetry, the seasonal weather, and other factors,” details Dr. Knap. “We have eight locations which provide a good representation of what is happening off the Texas coast.”
To design the system and select the right sites, team members accounted for the physics of the Texas coast and modeled the problem, identifying the most sensitive locations. The physics of the coastlines largely control problems like storm surge and flooding.
“We put the buoys in the places that are sensitive to the overall circulation of the Texas coast,” Dr. Knap describes. “The symmetry and the bottom topography will create a storm surge in some places and not others. The main thing is to try to understand differences from place to place and make sure you have a representative model that can help predict change.”
Why monitoring the Gulf Coast matters
Predictive power is certainly among the reasons to monitor, but there are many others.
“It’s important to know what the system is doing at a given time,” remarks Dr. Knap. “For example, if there’s an oil spill or a toxic algae bloom, the characteristics of the location determine the impact on that site and help predict where that event is going to go next.”
In a complex system such as the Gulf of Mexico, additional data from more such “moments” predicts with increased accuracy.
“The ocean water is responding to various forces anyway. In cases of contamination, such as an oil spill, it’s even more complex,” adds Dr. Knap. “Unless you have a baseline and a continual measurement at specific points, you’re sort of blind.”
Fortunately, the Texas General Land Office supports the TABS system and takes its work very seriously.
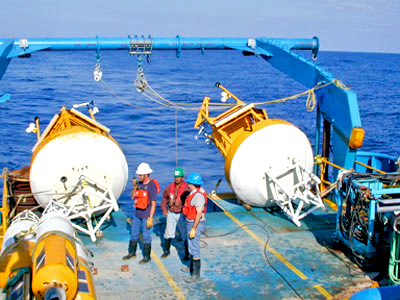
TABS buoys ready for deployment. (Image: via source)
“The TABS system was developed specifically due to the real chance of an offshore spill contaminating Texas beaches,” Dr. Knap states. “When you’re responding to an oil spill, it’s all about which way the current is going and how intense it is. Those factors help you model where the oil is going to go on the beach. You must ensure that you have the best possible prediction so you can deploy assets to control the effect of the spill in the most precise way.”
The amount of the existing data GERG has for the existing conditions is fairly unique.
“The Texas coast is probably one of the most oceanographically complete measured systems in the United States,” remarks Dr. Knap. “We have our buoys, high-frequency radars, gliders and wave-powered surface vehicles that give us information on currents and other water column parameters. I think we pretty much have the Texas coast covered other than the Flower Garden Banks – further offshore.”
Physics, climate change, and extreme weather
The GERG team is taking a holistic view, particularly with regard to climate variability. Whatever the cause of these changes, the team is committed to preparedness. Along the Texas coast, subsidence due to human activities and global sea level rise together generate more serious problems than they can alone.
“For example, subsidence can cause problems building roads, or affect the groundwater” comments Dr. Knap. “Then a global sea level rise of three milliliters per year occurs.”
That is very small, but over the course of decades or even hundreds of years, the change is significant—and it is a growing threat that demands both mitigation and prevention.
“The fact is, if you’re sitting on the coast, the land is subsiding, and sea level is going up, most of that sea level rise has to do with the ocean getting warmer as it expands,” says Dr. Knap. “In the ocean, you can also see the effect of heat on the intensity of hurricanes.”
Dr. Knap recalls the 2005 hurricane season, which was the deadliest and costliest on record. However, the ocean dynamics are changing fast.
“When I first got into the climate and hurricane world, everyone cared about the surface temperature of the ocean being 26.5 degrees centigrade; that was more or less considered to be the minimum trigger for tropical cyclones,” adds Dr. Knap. “What we’ve learned now is it has even more to do with the thickness and the temperature of the water below that surface of the ocean down to 75 meters or more. This represents a massive amount of energy, not just to start the storm, but to allow it to intensify and stay intensified by preventing it from cooling.”
To gather the right data underwater, the team uses automated gliders and other remote vehicles along with its buoy network to examine the thickness of upper ocean water.
“For example, in 2005, during Hurricane Rita, you looked at a map of the upper ocean of the Gulf of Mexico, and everything was red hot: 31 degrees centigrade,” continues Dr. Knap. “But right underneath, one meter down, the water was very cool. That hurricane could not be sustained – and could not intensify due to the cooler water below which de-intensified the storm.”
Clearly, an understanding of the upper limits of heat is important. But before these new measurement technologies, much of this was essentially poorly quantified. With an understanding of some conditions on certain days at set points in time, experts were limited to using climatology data from several decades to predict the future – we have now learned that real-time data is an important addition to historical data.
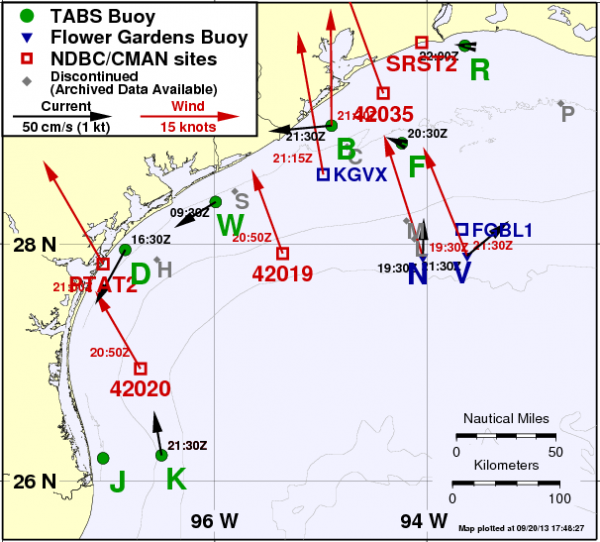
The TABS Buoy Network sponsored by the Texas General Land Office. (Image: via source)
“The problem is that it’s a very active and interactive process, so the upper ocean heat content during one storm may be completely different than the upper ocean heat content during another,” states Dr. Knap. “Rita decreased in Intensity, as many hurricanes tend to de-intensify as they reach the coast, losing some characteristics as they approach landfall. However, recently, Harvey intensified as it approached land; Michael, last year, did the same thing.”
Protecting our coastlines
These increasingly intense storms highlight the importance of TABS.
“Think about all of those aspects of what these storms can do, right? Dr. Knap comments. “They’re phenomenal, but it’s not just the damage to property it’s the overall vulnerability of the population.”
By building larger cities on coastlines, we place more people and property in danger.
“We’re starting to build megacities in the way of storms,” explains Dr. Knap. “When Harvey arrived, there hadn’t been anything greater than a hurricane category three – making landfall in the US for 12 years. This was the longest drought of major hurricanes since 1860. Until Harvey in 2017, the last landfalling storm of Category 3 or greater was Wilma in 2005. In between that period, coastal development increased putting more property in harm’s way.”
There is obviously no way to prevent the storms from coming. But monitoring and understanding ocean dynamics will help us better predict their paths, timing and intensity, helping to save lives and money.
“I think one of the key things for any coastal area is to have decent ocean observations,” confirms Dr. Knap. “Then at least you can predict what may happen and make sure people go to higher ground when they can. A lot of people tend to just ride it out—without detailed knowledge of what actually could happen in a specific storm. And this is where I think measurement and modeling is incredibly, incredibly important as it can inform prediction and save lives.”


0 comments