
Observation post: GVSU buoy observatory
Most observatories examine the distant sky. But on Michigan’s Muskegon Lake, an observatory looks under the water. Launched in the spring of 2011 by Grand Valley State University’s Annis Water Resources Institute, the Muskegon Lake Observatory project is no telescope. It’s a buoy system that carries dozens of sensors measuring weather and water parameters at multiple depths, collecting long-term data with an intensity never before seen on the lake.
At 4,150 acres, Muskegon Lake sits between Lake Michigan’s eastern shore and the mouth of the Muskegon River. A history of industrial pollution earned the lake a spot among the Great Lakes Areas of Concern, a list of water bodies bordering the lakes that the U.S. and Canadian governments consider especially polluted. The people who brought the buoy to the lake say the observatory will give researchers new insight into the lake’s inner workings, give managers a way to track progress of environmental restoration, and give teachers a tool to help students learn scientific principles in the context of their local environment.
 Watching the relationships between trends in any of the dozen parameters measured every 15 minutes at the buoy can change the way a scientist thinks about the dynamics of the lake, said Scott Kendall, research biologist with the institute and the observatory manager.
“It’s that ebb and flow of time-series information that allows you to interpret how these things interplay with each other in the ecosystem,” he said.
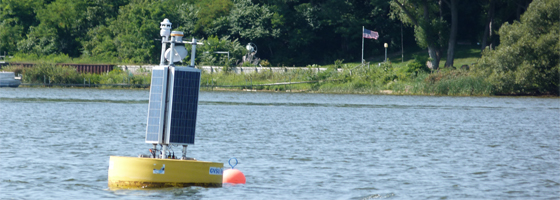
The system features a 5-foot surface buoy tethered to a small underwater buoy that supports PAR and nitrate sensors and line of six multi-parameter sensors and five temperature sensors at several depths. An acoustic Doppler current profiler resting on the lake bottom measures current speed and direction. The big surface buoy carries solar panels, a meteorological station, and a data logger that beams data back to the water resources institutes’s lab on the lake’s southeastern shore. From there the data is published to the buoy’s website for all to see.
The system began recording data in May 2011 after the project team launched the buoy with the help of the Laurentian, the 80-foot research ship operated by the National Oceanic and Atmospheric Administration’s Great Lakes Environmental Research Laboratory. This first round of data will give researchers a rich source of baseline data and help comprehend ongoing ecosystem changes, according to Bopi Biddanda, aquatic microbial ecologist with the institute and principle investigator on the project.
“Come next year or in ten years, we’ll have this data to compare,” he said. “Whatever we are measuring, there will be background data.”
Leon Gereaux, a graduate student at the institute, uses the observatory data to understand seasonal changes within the lake. He hopes to analyze a full-year’s worth of data and develop models of ecosystem drivers.
“By closely following trends in temperature, nutrients, phytoplankton abundance, dissolved oxygen and other variables, one can really take the pulse of the lake ecosystem through the different seasons,” he said.
 The data could also play a role in efforts to end Muskegon Lake’s tenure as a Great Lakes Area of Concern. In the world of Area of Concern management, the ultimate goal is to get off the list by restoring habitat and cutting pollution. Escaping the list is a rare feat; only a handful of the original 43 sites have done it. But local environmental officials think Muskegon Lake is close, according to a recent update of the state’s cleanup plan for the lake. The plan aims to correct the lake’s official environmental impairments by 2017.
One key to moving towards shaking off the Area of Concern label is showing measurable progress. The observatory can help with that, Kendall says. For example, according to the U.S. Environmental Protection Agency, one of the lake’s official problems is “eutrophication or undesirable algae.” The buoy carries sensors for dissolved oxygen, chlorophyll, and phycocyanin at four depths. In time, researchers and regulators will have an intensive long-term data set to evaluate the trends in the parameters tied directly to algae growth and eutrophication.
Data from the observatory can also provide insights into the lake’s other official impairments. For example, according to the EPA, the lake suffers from “degradation of fish and wildlife populations” and “loss of fish and wildlife habitat.” The buoy doesn’t count fish, nor does it measure habitat. But observatory data is already showing researchers new information that may indicate where and when fish can and can’t thrive in the lake.
When six months of the observatory’s temperature or dissolved oxygen data from multiple depths are layered in a line graph, the separation between the lake’s warmer top layer and cooler bottom layer is plain as day. The transition between the two layers occurred at around 6 meters in the summer of 2011, and dissolved oxygen readings below this line are much lower than those from above, occasionally even dipping into anoxia.
If oxygen in the lake’s bottom layer is as low across the lake as it is at the buoy site, Muskegon Lake may have a slice of cold water habitat that isn’t accessible to fish like lake sturgeon.
The project is funded by a $560,000 grant through the Great Lakes Restoration Initiative, a federal program coordinated by the EPA. As an EPA-funded project, the data must meet strict quality control standards. A 115-page quality assurance plan assembled by the project team details the steps to make sure the sensors are delivering accurate, precise measurements. That includes testing sensors in the lab fresh from the lake, before they’re cleaned and recalibrated.
“We’re doing regular laboratory checks of uncleaned sensors and we’re also monitoring the time-series data,” Kendall said. “We know that data is good.”
The institute didn’t just have managers and scientists in mind when they designed the project. Kendall envisions local teachers using the data to meet state science curriculum requirements. A lesson on photosynthesis, for example, could use a graph of dissolved oxygen levels rising throughout the day and falling after the sun goes down.
“It’s a way to get out of the book and into the local environment and learn how to mix theory with practice,” Kendall said.


0 comments