
Using Conductivity As A Tracer Yields More Data, Lower Costs
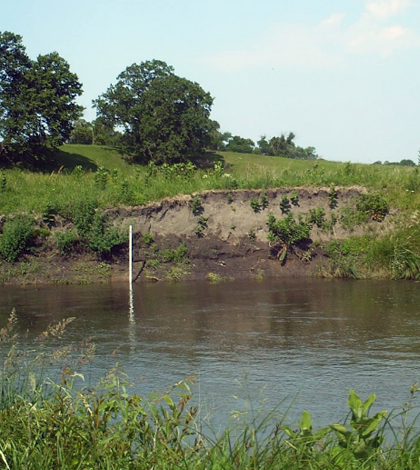
Elm Creek at an average flow level for late spring. Groundwater can be seen seeping through the lower portion of the bank. (Credit: Chris Lenhart / University of Minnesota)
Many studies tracking the movement of groundwater these days rely on the use of isotopes, such as those of oxygen and hydrogen, to gauge where the water’s from. That method involves taking water samples manually and then lugging them back to the lab for analysis. But there may be another way, say scientists at the University of Minnesota. They’ve found that using specific conductivity as a tracer holds a lot of promise.
Chris Lenhart, research assistant professor in the university’s Department of Bioproducts and Biosystems Engineering, thinks he knows why using conductivity as a tracer hasn’t caught on nearly as much.
“People have seen it for a while. It’s not a brand-new, cutting-edge method,” said Lenhart. “People think, ‘Yeah, yeah, I learned about that in Limnology.’ Isotopes are more awe-inspiring.” However, relatively, new data loggers allow for the collection of tens of thousands of data points in a season, allowing researchers to clearly distinguish water sources.
He first noticed just how useful the parameter was in tracing groundwater movement while out in the field with Joe Magner, research professor in the same department. They were working at Elm Creek in southern Minnesota, gathering measurements with a YSI probe.
Lenhart started to see that the conductivity measurements coming in were correlated with the water source. For those data that were around 0-20 microsiemens per centimeter (uS/cm), it was safe to assume they were coming from fresh rainfall. For measurements in the range of 50 to 400, that was more recent runoff.

A graduate student collects a water sample. (Credit: Chris Lenhart / University of Minnesota)
“The thing is that, in the soil, water picks up cations and anions and there’s a real clear delineation between groundwater, tile flow, rainfall and recent runoff,” said Lenhart. “From tile drains, it’s somewhere around 600 to 800 uS/cm with groundwater over 1,200 uS/cm in calcareous glacial till typical of much of the northern parts of the Midwest.”
He and other researchers in his lab have used conductivity as a tracer successfully in several studies. In a following investigation for the Minnesota Department of Agriculture, part of which took place in Elm Creek, investigators assessed hydrological processes in relation to increased rates of stream bank erosion.
Part of that study was dissecting water sources in the flows of streams under consideration. Solinst LTC Leveloggers, deployed in shallow monitoring wells, gathered data on level, temperature and conductivity to inform observations.
“In these agricultural areas with the upper to western part of the Midwest, there has been a lot of increased flow in rivers. And people wanted to know how much tile drains were contributing to erosion. People have been debating that issue for a long time,” said Lenhart. “For Elm Creek, we looked at the flow sources and calculated that, on an annual basis, about 70 percent of the river flow had come from tiles in 2014.” Although the highest flows cause the most erosion, he says, the increased volume of flow contributes to higher flows across the board and more frequent initiation of erosion in the channels.
That number (70 percent) was larger than expected, Lenhart says, while noting that it made sense because of the widespread nature and increasing density of tile drains in the watershed.
Lenhart and others have used conductivity as a tracer in a few other investigations. These include a look at the rainfall responses of experimental stands of black ash trees in northern Minnesota and the variability of flows in a subsurface-drained landscape in Iowa. Other scientists from the U.S. Geological Survey’s Utah Water Science Center, he says, have used the approach successfully on snowmelt-dominated streams in the Colorado River Basin.

A hydrograph separation using specific conductivity between tile flow and groundwater flow. (Credit: Chris Lenhart / University of Minnesota)
But still, there are some important limitations to note when using conductivity as a tracer. There is a lot of variability in the conductivity values that can emerge. Likewise, it’s important to consider that baseline levels of conductivity can change depending on the region.
“If you know the range of local values, you can use it successfully,” said Lenhart. “… In some ways it’s more simple than other approaches, but regionality is an issue.”
That’s because soil properties and geologic setting vary from area to another. Variables like glacial till or karst systems can influence what conductivity baselines are. Other complicating factors include treatments for snowy roads, which can introduce a lot of salinity, a parameter close to conductivity.
“There are some things that can mess that up and can spike the conductivity numbers, such as road salt. But in rural areas, it has worked pretty well,” said Lenhart. “… It’s not a silver bullet. It does give you a lot of data, but it’s probably best used in concert with other approaches. We’re also doing isotopes and flow monitoring to identify water sources.”
So what can be done to spur the adoption of using conductivity as a tracer? The benefits the approach offers, such as more data and lower costs, haven’t yet edged it into the monitoring mainstream.
Lenhart says it could start with government agencies making conductivity data standard measurements at their sites. He notes the U.S. Geological Survey gathers data at some of its streamgage sites, depending on the needs of different investigations. But something like deploying a conductivity logger with stream gauging sites or new drainage control structures when they’re installed could provide some outstanding insights.
“Once you build up regional water data sets, soil and water conservation districts (SWCDs) might start using them and applying them in their own situations,” said Lenhart. “It’s something that doesn’t have to be done everywhere since a few long-term studies can serve as a benchmark for a region. But with local stormwater managers and SWCD stuff, just providing education and training could spread more use since it is a cost-effective and straightforward technique.”
Top image: Elm Creek at an average flow level for late spring. Groundwater can be seen seeping through the lower portion of the bank. (Credit: Chris Lenhart / University of Minnesota)


0 comments