
Weather Bikes Stand Out In Urban Studies, Advance Science Dialogue
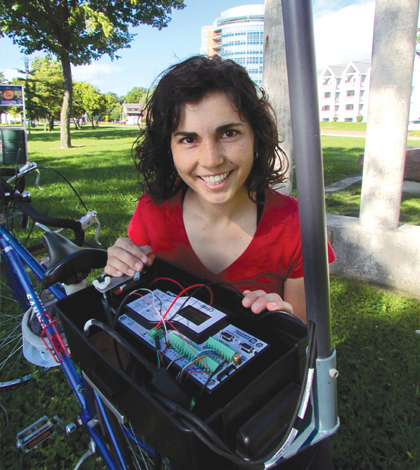
PhD candidate Carly Ziter displays the interior wiring of the custom-designed bike sensor system used to study the urban heat island effect in Madison, Wisc. (Credit: Eric Pedersen / University of Wisconsin)
Bikes are one of the most time-tested methods of transportation. People have been riding them for centuries. But it has been only recently that folks started strapping on high-tech sensors to turn bikes into mobile labs for studying things like air pollution and the urban heat island effect.
These weather bikes provide the ultimate in data collection for some studies. This is because they’re not limited to a specific area. Their riders can weave and dodge through traffic, steer down alleyways or wheel through regions with or without vegetation. There are all sorts of dynamics at play that stationary sensing devices just can’t capture.
“By having it all in one mobile, portable setup, we can cover a greater area of the city,” said Carly Ziter, doctoral student in zoology at the University of Wisconsin who is using a weather bike around Madison. “We can reach areas that aren’t accessible by other methods. It also avoids issues with leaving expensive equipment throughout the city. The advantage is that you can take it all with you.”
We recently spoke with Ziter and a few other scientists who are leveraging the potential of bikes as platforms for mobile research. These include Steve Hankey, an assistant professor of urban affairs and planning at Virginia Tech, and Paul Coseo who is an assistant professor at The Design School at Arizona State University.
Each clued us in on how they’re using or have used weather bikes to research important issues facing cities around the U.S. Urban heat island is a big one, but investigators are also tackling small-scale air pollution and the effectiveness of green infrastructure.
A big thanks to Nick Rajkovich, assistant professor of architecture at the University at Buffalo, who gave us the scoop on these researchers after telling us about his efforts to study urban heat island in Cleveland using bike-mounted sensors. His work, which we covered on our news site, spanned urban and rural regions and revealed that air temperatures were often lower near water or trees, an expected find. But there is still more he’d like to learn about the impacts of cars and industry on the city’s heat island effect.
Tracking Urban Heat Island

PhD candidate Carly Ziter uses a bicycle-based temperature sensor to collect data in a city park in Madison, Wisc. Ziter’s study investigates the role of urban trees in mitigating hot summer temperatures. (Credit: Eric Pedersen / University of Wisconsin)
Questions on vegetation are at the heart of Ziter’s research in Madison, Wisc., a city known for its lakes with a slightly smaller population than Cleveland. That could change in the future as Madison’s population continues to grow, introducing a host of new issues land managers will have to contend with.
She has been riding her weather bike around the city for the past year, gathering measurements on temperature and solar radiation. The data are adding to a repository of knowledge collected by static sensors that other researchers at the university have deployed.
These were launched by Chris Kucharik, professor of agronomy at the university, and Jason Schatz who is a postdoctoral researcher there. They’ve amassed around four years of research on urban heat island in the city as part of the Water Sustainability and Climate Project.
Along the way, they and others have found that the growing season within urban Madison is about a week longer than rural areas surrounding it because of extra heat. But the parks within the city have an effect that normalizes the average length of the growing season in the city to be more like that of its rural counterpart.
“We’re building on those long-term efforts and trying to fill in the gaps to see what’s driving temperatures,” said Ziter. The bike is a great way to do that since it can cover all the areas that the stationary temperature sensors can’t.
In addition to its pyranometer and Campbell Scientific rapid-response temperature sensor, its payload includes a GPS which is important for keeping track of where measurements are taken.
“It’s all wired to a data logger and battery and we program it on a computer to take measurements every second as we’re riding,” said Ziter. “It’s actually portable. You can move it from bike to bike as long as you have a standard bike rack.”
That’s something we haven’t commonly seen on other platforms, and the portability means that multiple riders can use the equipment to gather data around Madison. Most of these rides have taken place during the day, but Ziter says a few have been done at night.

This bicycle-mounted temperature sensor (designed at the University of Wisconsin – Madison) provides an efficient, cost-effective way to study fine-scale variation in the urban heat island. (Credit: Carly Ziter / University of Wisconsin)
She and others are seeking to get a high-resolution dataset of the region’s temperature dynamics, no matter where they have to take the bike.
“There’s the urban heat island effect inside the city but we understand that temperatures don’t just differ between the city and the surrounding area. There are differences within the city itself,” said Ziter. “We want to fill in gaps between urban forests, parks and trees. By capturing data at a rapid rate, it allows us to capture the data we need at a fine scale.”
With winter setting in, bike rides aren’t as frequent as they are in the summer. And the time typically spent riding is now going toward analyzing the data that’s been gathered.
Ziter doesn’t yet have concrete findings to share. But there are a few trends that have started to take shape.
“There’s a lot of variation in temperatures and a lot is driven by the canopy. We’re starting to tease out the details of that,” said Ziter. “We know trees are important, but is there a certain number or density, or a period when we should be planting?”
That there has been so much variation isn’t a surprise, but Ziter admits she was a little taken with just how quickly temperatures can change over a short distance. It may be that vegetation is an important consideration, as previous research by Kucharik and others has shown.
But more work needs to be done to nail down the finer points of what that means exactly. There is a strong correlation between temperatures and vegetation, she says, but previous works haven’t yet determined how important different vegetation types can be. Hopes are that rides on the weather bike can reveal the dynamics at play.
“We know that urban heat island is becoming more important as people move into cities. And we are expecting more heat with climate change,” said Ziter. “… It’s important to remember that when you’re dealing with trees, they take years to grow. So hopefully by including new techniques like this bike we can increase understanding and inform management decisions.”
Funding for Ziter’s work is provided by the National Science Foundation and the Garden Club of America’s Urban Forestry Partnership.
Biking Against Air Pollution

A student in Assistant Professor Steve Hankey’s lab at Virginia Tech poses with their weather bike, outfitted to track air pollution. (Credit: Steve Hankey / Virginia Tech)
Conventional air quality samplers, complete with screens and filters for gathering contaminants, don’t offer a lot of resolution to the data they collect. That is, they really only keep tabs on the areas around them.
Because of those limitations, it wasn’t hard for Steve Hankey to see the upside of using bike-mounted sensors to take measurements of air quality. He first got into using them during research for his doctoral dissertation in Minneapolis.
“You have to take measurements at many sites, typically with stationary monitors. It’s really expensive to do,” said Hankey. He says that each one can cost up to $8,000 and anywhere from 25 to 100 would be needed to get the sort of coverage he can get with sensors on his bike. “We started doing these with a bicycle to get a spatial measurement and to do it in a cost-effective way. We wanted to see if we could get a better idea of what cyclists are exposed to.”
The work in Minneapolis was a starting point for the efforts underway these days. Back then, Hankey was the main rider, but nowadays he has help from students in his lab. He’s also been able to tweak the design and ensure that some really spectacular data can be collected.
The bike he and others are using around Blacksburg, Va., is outfitted with some advanced air quality sensors we’d never heard of. They include a micro aethalometer that gathers particulates on a filter and then blasts them with a laser to discern optical properties. Also onboard is a condensation particle counter that enlarges particles through cold condensation and then heated rubbing alcohol to create droplets large enough for the sensor to analyze.
They’re so much cooler than any other particulate sampler we’ve seen.
“The really old school way is to collect air samples on a filter and weigh them,” said Hankey. “But the devices we’re using can measure every second, tagged with a GPS location.”
Students in his lab take turns riding those new sensors around Blacksburg, in shifts that line up every two hours throughout the day’s sampling period.
Hankey told us that the rides began in late August 2016 and were on track to be completed in the middle of October. The goal was to reach 1,500 miles of total distance. Around 700 had been ridden at that point, so there weren’t a lot of findings to share. But Hankey was able to give some perspective based on his previous research.

Instrumentation used to study air pollutants on the back of a weather bike. (Credit: Steve Hankey / Virginia Tech)
“In Minneapolis, we found that these pollutants degrade pretty quickly as you get away from major roads. For example, if you just moved one block away … that could reduce your exposure by 15 to 20 percent,” said Hankey. “It’s a pretty minor shift to note if you’re planning a bicycle network.”
He and others also developed models using the air quality measurements, on a 50- to 100-meter scale, showing patterns across Minneapolis. That was the primary goal of the work there, during which Hankey made plenty of bike rides through rush hour.
“What we’re trying to do here in Blacksburg is all day — from 7 a.m. to 7 p.m. Our typical concerns are: Is the weather normal? Is it different? Are there spatial patterns?” said Hankey. “We want to see how they change over the course of the day. It’s similar, but we’re going a step deeper.”
As in Minneapolis, plans are to share findings with the Town of Blacksburg once they’re available. In Minneapolis, the local pollution control agency is using the findings to help in future plans. Officials there have also begun riding their own sensor-equipped bike to gather more data.
Officials in Blacksburg are aware of the work and are interested in seeing the results. Hankey says that other researchers at the university will also see them, and plans are to launch a website that can serve the general public as well.
“We’re interested in the effects on designing healthy neighborhoods and other structures. We’re measuring bike and health assessments, even looking at people’s moods,” said Hankey. “How do you find communities with low exposure to contaminants? Or are there effects on mental health? We’re actively compiling a website to make sure the info is available so they can know where they should bike or walk.”
Gauging Green Infrastructure

Paul Coseo, currently an assistant professor at The Design School at Arizona State University, takes notes near his weather bike during a 2010 investigation in Chicago. (Credit: Paul Coseo / Arizona State University)
For Paul Coseo, using a weather bike had an altogether different goal. He was interested in assessing the effectiveness of Chicago’s Green Alley Program, an effort that was just in its beginning stages during his 2010 research.
“We were looking at heat vulnerability in eight Chicago neighborhoods. The trike was used to examine Chicago’s Green Alley Program. As part of that program, the City was redoing alley ways to test out new pavement types such as highly reflective and porous pavements,” said Coseo. “There were a couple goals for the program, but one was to reduce urban heat islands.”
He says that he and others, including Nick Rajkovich, designed the bike to be a mobile weather station to take measurements. They rode around Chicago using a first-generation trike, and would soon learn that three wheels work better than two (a second-generation bike was used in Rajkovich’s Cleveland study) for the kind of sampling they were after. Stops were made at certain locations along alleys, with riders resting at each around six seconds so that sensors onboard could gather measurements.
Those included an anemometer for wind dynamics and a net radiometer, for irradiance, as well as sensors for air temperature and humidity mounted on a mast. A pyranometer gathered measurements of solar radiation and a GPS unit onboard kept track of the rider’s location.
Along with those sensors on the bike, there were also HOBO loggers deployed on utility poles in the alley ways Coseo traversed.

A system diagram showing sensors mounted on the tricycle used to study alley ways in Chicago. (Credit: Paul Coseo / Arizona State University)
“I could raise the mast up and take measurements at each predetermined location,” said Coseo. “When we combined that with the HOBO weather stations, we could get a nice cross-section of the urban climate with the trike. It wasn’t so easy to move long distances, but the bike was great for short stretches in Chicago.”
This sort of approach took place across eight neighborhoods in Chicago. Broken into groups of two, researchers had four pairs of alley ways to compare. Each pair contained a conventional alley way and another that had been upgraded in some way.
Most of the treatments used were meant to battle stormwater in a bid to help fight the city’s persistent flooding problem.
“Sometimes they’d use high-reflectance pavements with high albedo, porous pavement or other pavers,” said Coseo. “The heat island effect seemed more like a secondary concern to flooding, which makes sense because of the recent uptick in flood events.”
The results of the effort were different than some might expect. The porous pavers or reflective surfaces that were used didn’t have much of an impact on urban heat.
“There are so many other surfaces contributing to air temperatures that changing one surface had little effect on that. When I looked at porous pavers, they did have lower surface temperature than conventional asphalt,” said Coseo. “But in terms of the actual effects on air temperature, it’s much more complicated.”
Coseo says that he was surprised by the findings, as he had thought there would be some sort of measurable impact from the green alley ways. But he notes that the results probably serve as good proof that more sophisticated sensors are needed to measure the dynamics that take place in sometimes very tight spaces.
Conversation Starters

A Virginia Tech student goes for a ride around Blacksburg, Va., with Assistant Professor Steve Hankey’s weather bike. (Credit: Steve Hankey / Virginia Tech)
The potential of weather bikes is clearly huge for data collection. But these sensor-equipped crafts have other uses. Sure, they can also provide those riding them with a nice workout while gathering measurements. But along the trip, these bikes provide an incredibly valuable icebreaker allowing scientists to communicate directly with folks who often have no idea what’s going on.
“People would take a look. They’d walk up, probably expecting to see a baby. But they’d walk up and see lights and tubes everywhere. I’m sure many people were sure I was the Google Street View guy,” said Hankey. “But as a cyclist, it was nice to have people pull up and talk for 10 minutes or so.”
Coseo had a similar experience, even getting help from a few youngsters hanging out on a stoop when his sensor mast broke one day.
“I loved being able to have conversations about what I was doing in fairly diverse neighborhoods,” said Coseo. “I had people literally stop their cars to ask me what I was doing.”
Ziter gets at least one question every time that she goes out for a ride.
“This new technique can help us grapple with the fine-scale issue in an interesting way. It’s really visible and encourages a lot of engagement with the public. There’s a lot of value for getting science into the community,” said Ziter. “Most people say, ‘Hey, what’s on your bike?’ Some people guess that it’s a weather station. It leads to a conversation about the area.”
Top image: PhD candidate Carly Ziter displays the interior wiring of the custom-designed bike sensor system used to study the urban heat island effect in Madison, Wisc. (Credit: Eric Pedersen / University of Wisconsin)


0 comments