Agriculture Changing Sediment and Nutrient Concentrations in Acton Lake
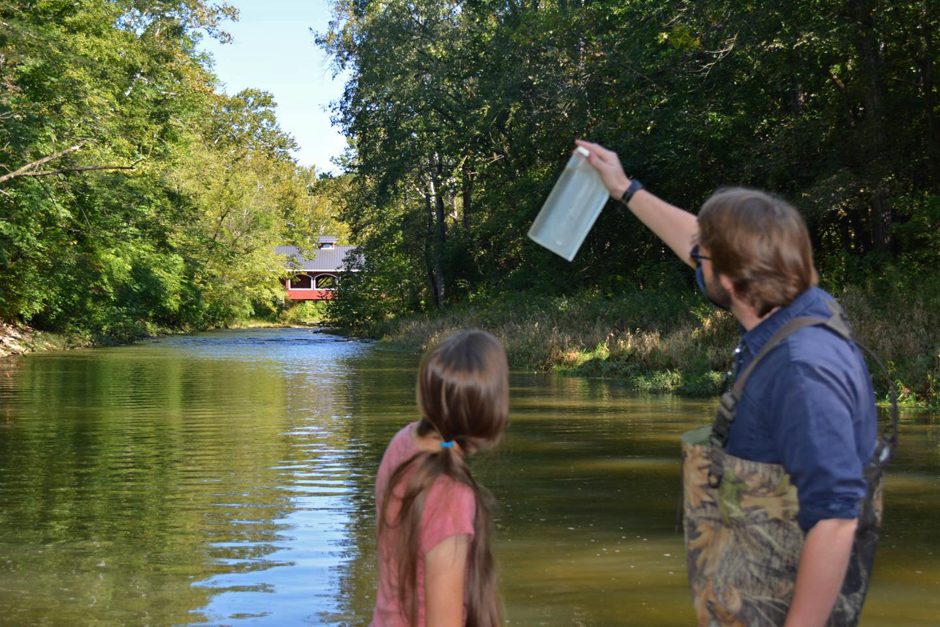 Graduate students Heather Luken and Tanner Williamson collect water samples from an automated sampler on Four Mile Creek. The autosampler collects a water sample from the stream every seven hours, and stores 24 samples in the carousel of bottles shown here. (Credit: Carrie Ann Sharitt, https://www.eurekalert.org/multimedia/pub/189404.php)
Since the early 1990s, officials in southwestern Ohio have been working to improve the water quality and clarity in Acton Lake. Local farming operations had been producing large amounts of sediment that were draining into the lake’s watershed and filling up the lake. The United States Department of Agriculture (USDA) instructed local farmers in conservation tillage, which involves plowing the soil less frequently to reduce sediment runoff.
Now, new research based on the years of data produced from managing Acton Lake reveals an interesting trend: stratification of nutrients in soil due to conservation tillage may be having unintended consequences in the watershed. Study co-author Michael Vanni, a biologist at Miami University, Ohio, spoke to EM about the research.
“This wasn’t started as a long term study of changes caused by agricultural practices,” explains Dr. Vanni. “We put in our first sampler back in 1992, and we were mainly looking at fish that live in the lake called gizzard shad. They are really abundant, and they are a bit unusual because they feed on the muddy lake bottom and then excrete nutrients into the lake water. We wanted to compare how much nitrogen and phosphorous were coming in from the watershed, versus what was being supplied by the fish. We thought that movement of nutrients through the fish could be really important—and it turns out that it is.”
The team put out some automated samplers to acquire good data on the nutrients coming in from the streams, and after approximately eight years and several related projects, the researchers realized that the concentrations were changing.
“We knew that around 1990 or 1992 the USDA targeted the watershed to try to reduce soil erosion because basically, the lake was filling in with sediment,” details Dr. Vanni. “People were having a hard time getting their boats out, and they actually had to stop using some upstream docks where it got too shallow. The USDA Soil Conservation Service gave the farmers economic incentives to implement conservation tillage, a practice which uses less plowing, less tilling of the land, to reduce soil erosion.”
The program eventually continued under the auspices of the Long Term Research in Environmental Biology (LTREB) funding program at the National Science Foundation (NSF).
“You can’t even apply to that program until you have six years of data on whatever system you are studying,” Dr. Vanni describes. “So after we had about eight years of data, we said, that program seems appropriate for us, and subsequently we’ve had fifteen years of funding from them. Serendipity plays a huge role.”
Changing practices, changing concentrations
Dr. Vanni’s team was seeing a decrease in suspended sediment—a change which made sense to them, given less soil erosion, and a decrease in soluble phosphorus. However, after about the second decade, things changed.
“Soluble phosphorus started increasing again,” remarks Dr. Vanni. “Sediment is still declining, but at a slower rate, and phosphorus actually started to increase, and although the concentrations are still lower than at the beginning of the study, they are not much lower anymore. Then suddenly in the second decade, concentrations of nitrates started to decline really rapidly, whereas in the first decade not much had changed. In other words, nitrogen and phosphorus were doing completely different things at that point, with sediment somewhere in between. That was a big surprise, that things kind of reversed in that second decade, but at the same time, another group studying pretty similar processes in the rivers draining into Lake Erie found the same kind of reversal of trends.”
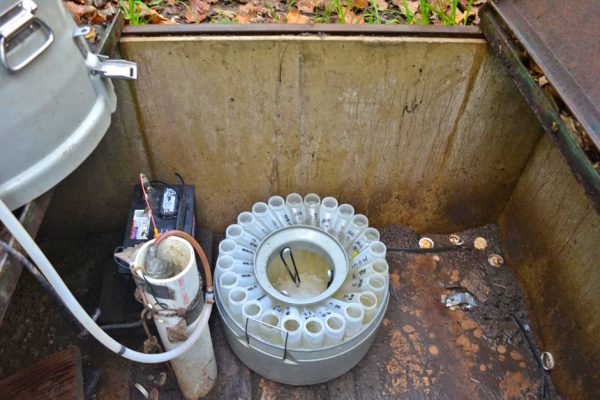
The inside of the automated sampler on Four Mile Creek, with the carousel of bottles used to collect water samples. The PVC pipe to the left houses a pressure transducer connected to a data logger and records the stage (height) of the stream water every ten minutes for a continuous record of stream flow. (Credit: Carrie Ann Sharitt, https://www.eurekalert.org/multimedia/pub/189405.php?from=416467)
This was not only surprising but also troubling, from a management perspective.
“The goal is to reduce sediment inputs into the lake, and that seems to be what’s happening,” Dr. Vanni points out. “But no one wants phosphorus to increase, and we are not really sure of the mechanisms that are making it happen.”
The theory that has been proposed the most in the Lake Erie watershed is that after many years of not tilling the land, phosphorus has accumulated at the surface of the soil, rather than being mixed into it during plowing. Then, during storms, it more easily runs off into lakes.
“It takes a while, maybe a decade or so for that to happen” clarifies Dr. Vanni. “And then, suddenly, you have phosphorus building up in the soil. Phosphorus occurs in two forms: the soluble form which experienced the increase, and phosphorus attached to sediment particles. That is still declining because sediment is declining. So although total phosphorus is probably still in a net decline, the soluble phosphorus is what’s readily available to the algae and could cause algal blooms.”
Thinking differently about best management practices
It’s hard to say how these findings could change what best management practices looks like in this area.
“The watershed was targeted because of sediment, not because of nutrients,” states Dr. Vanni. “Lake Erie got cleaner, and then about 15 or 20 years ago, we started getting these algal blooms again, and this is one potential mechanism. In our study lake, Acton Lake, we also are seeing an increase in algae over the years. We think that is partly due to more light in the water, but the actual increases in nutrients are actually coming from fish. The fish population has increased over time, maybe related to the soil management thing, we don’t know.”
Still, there are several important takeaways from this work.
“First, there is such a strong connection between what happens on land and the downstream body of water that gets the runoff,” remarks Dr. Vanni. “Another takeaway is that we really need long term data to see what’s going on. We have almost 25 years of data now, and we still don’t think it’s reached any kind of steady state yet, even after that much time. Finally, we have already seen ecological surprises after a decade into it, and now we have two decades or more, so what is going to happen after the third decade? Things can change and surprise us.”
From a water quality perspective, this research presents a bit of a conundrum for water quality management, because what might be best for managing sediment inputs might not work as well for phosphorus or nitrogen.
“There are tradeoffs, I guess, that’s the way to look at it,” comments Dr. Vanni. “We don’t really know how long a lake takes to get back to its ‘natural state.’ Sometimes it takes a really long time to get back to where you want it to go. On the other hand, sometimes lakes, like all ecosystems, can reach a tipping point and change abruptly.
Furthermore, as our climate changes, what constitutes a “natural state” may, too.
“Lots of studies are showing now that every decade or so lakes are having another week of ice-free time,” adds Dr. Vanni. “In some lakes, the water temperatures are increasing faster than the air temperature. But in our area, and in similar agricultural landscapes, while the temperature effects are probably going to be important, they might be less important than the effects we are seeing with precipitation. Big storms are what bring in a lot of the nutrients. In our lake, for example, 50, 60, or even 70 percent of the nutrients that come in one year, come in a matter of about 10 days.”
This drives home the importance of long term data and the ease of finding new uses for it.
“Ideally you have a study and you are collecting data for a reason,” says Dr. Vanni. “You are not just measuring things for the sake of measuring things. But then, you have data 5, 10, 20 years and suddenly you see these surprises that you wouldn’t have detected without those long term data. A few papers have come out recently showing the value of long term research—that per dollar spent you get more information from long term projects.”


0 comments