Amid Flint Water Crisis, GIS Effort Maps City’s Pipes
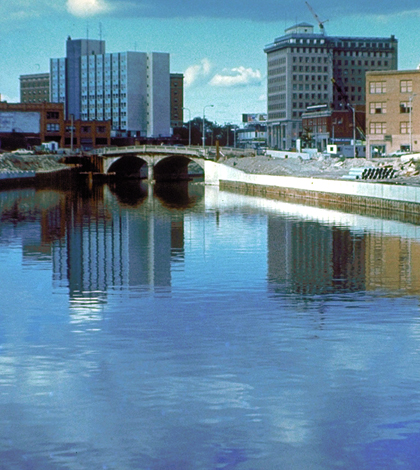
The Flint River in Michigan circa 1979. (Credit: U.S. Army Corps of Engineers)
The City of Flint, Michigan’s drinking water woes have been national news for weeks. So have the difficulties that those working on the ground have dealt with.
One headache, which isn’t altogether uncommon for any American city, is poor record-keeping. As folks working to respond to the high levels of lead in the city’s water found, Flint’s water utility didn’t have data showing the precise locations of lead pipes in the city.
So when researchers at the University of Michigan – Flint set out to begin a GIS mapping effort to document where city pipes were located, even before the current state of emergency declared in January, they found that there was little to work with.
“We approached the city back in October (2015). It was after the state of emergency that a couple of other agencies started mapping,” said Marty Kaufman, professor and chair of the Department of Earth and Resource Science at the university. He is leading an effort to map all the city’s water pipes to pinpoint where the lead ones are. “The records were on some type of spreadsheet that looked like something out of the library I grew up using in middle school. That was in the 1960s when we didn’t have automatic record-keeping.”
It was surprising that the records were so lacking, Kaufman says, simply because the water utility is a fairly large one that oversees drinking water for more than 100,000 people. But to make up for the holes in the data, he and others had to find a workaround.
That process began with taking digital images that the city had showing the existence of water pipes, typically marked with letters indicating what metal they were made of. Copper pipes, for example, were marked with a “C,” while lead ones were marked with an “L.” From there, it was a matter of decrypting the letters, which were sometimes hard to make out, and then transferring them to parcel maps.
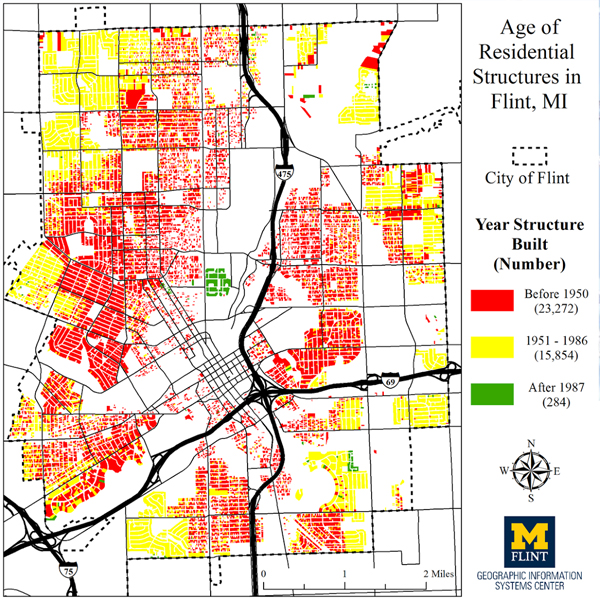
Pipes in green, built after 1986, can be assumed to not have any lead because the material was outlawed for use in pipe construction that year. (Credit: Marty Kaufman & Troy Rosencrants / University of Michigan – Flint Geographic Information Systems Center)
“We can georeference them with an existing database of parcels,” said Kaufman. “By copying the code from plastic images into a real database, that allows us to look for clusters of pipes. That allows association to lead levels.” There were some parcels that didn’t have markings indicating what type of pipes were used, so physical inspections will need to be done on those, Kaufman says.
The effort has pretty much wrapped up, but is in a quality-control phase right now. Researchers are adding metadata to the maps that they’ve created to offer descriptions that will help those who use them have an easier experience. The metadata will also help Kaufman’s crew as their work into the drinking water problems continues, such as helping construction workers looking for lead pipes or predicting where medical problems — like high levels of lead in blood — may be prevalent.
And there are some useful insights to report. Kaufman says that most of the lead pipes are ones that branch off of main channels and link directly to homes.
“That’s where the lead is. There’s a potential for lead in the mains in bell and spigot joints made before 1950, which may have lead as a joiner,” said Kaufman. “It’s unlikely, but it’s possible. It’s hard to know because the records in the city were very poor.”
The maps will include shades to indicate ages of pipes as well, broken down by those installed before 1950, between 1950 and 1986, and those that came after. The post-1986 ones can easily be assumed to not have lead because that was the year that using lead in pipes was outlawed.
Taking factors like that into consideration with the parcel maps, Kaufman says that some zones of the city are more likely to have lead pipes than others. These hot spots appear to make a ring around the city’s outskirts. Toward the city’s center, the problem isn’t as common.
“We’re still looking at the data, but it’s probably correlated with the oldest homes in Flint,” said Kaufman. “It makes kind of a ring around the town center on all sides.”
Once the project wraps up, Kaufman expects that the maps he and others from the university’s Geographic Information Systems Center have generated will prove useful for tackling Flint’s water crisis. The approach could also be used in solving drinking water problems encountered by other cities with poor records of where pipes are located.
“All water utilities should try to map all locations of their pipes, including the ones going into homes,” said Kaufman.
Top image: The Flint River in Michigan circa 1979. (Credit: U.S. Army Corps of Engineers)


0 comments