At Heidelberg University’s NCWQR, Stream Monitoring, Modeling And More
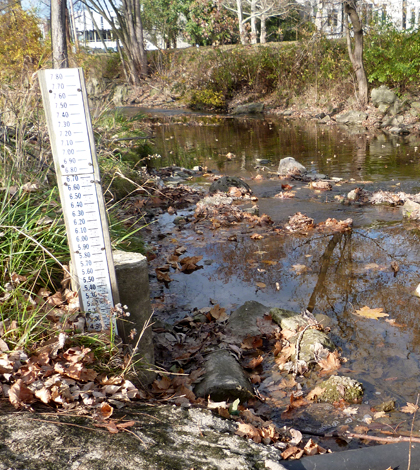
A staff gauge tracks Tiffin, Ohio’s Rock Creek’s water levels. Its water is pumped out for sampling through a pipe. (Credit: Daniel Kelly / Fondriest Environmental)
What started as a simple biology project for a class at Heidelberg University is today the National Center for Water Quality Research (NCWQR). It’s a beautiful example of how far small actions of the past can ripple into the future.
“It was actually an outgrowth of an educational drive,” said Ellen Ewing, laboratory manager at the NCWQR who was working at the Center at its beginning. “Dave Baker, who is our director emeritus, was a professor here at Heidelberg and he wanted to introduce some new concepts to the introductory biology classes. And so he put together a program for a National Science Foundation grant and started with some sample collection on the Sandusky River.”
We caught up with Ewing and Jake Boehler, a research assistant at the Center, on a recent visit to Heidelberg University in Tiffin, Ohio. The two are part of the team that goes out every week throughout the year to gather water samples collected by automated monitoring stations on many of Ohio’s waterways, helping to assess their nutrient loads, which affect water quality downstream and, for one of the stations, forms the basis of Lake Erie algal bloom forecasting.
The purpose of the biology project that started it all, Ewing says, was to introduce inexperienced biology students to the processes of sampling. It focused on the Sandusky River and incorporated taking water samples from the river and then analyzing them in a series of lab experiments focused on bacteria, phosphorus and nitrogen loads.
That first project generated a lot of interest into the issue of tributary nutrient loads, Ewing says. And from there, more advanced summer research projects, driven by undergraduate students, would follow. Slowly but surely, the projects began to yield interesting and useful data that would become the foundation of important discoveries, including one on the influences that different flow regimes have on the movement of nutrients to Lake Erie.
“In 1969, this area sustained a 100-year flood and the student project that was written up was to study the Sandusky (River) during low flow. Well, in a 100-year flood, you kind of don’t have low flow. So, like all good researchers, they persevered and started to generate some interesting numbers,” said Ewing. “About that time, the federal agencies were getting involved. Lake Erie was dead, all those kinds of scenarios — the Cuyahoga River caught on fire. And so what Dr. Baker (David Baker, director emeritus and founder of the NCWQR) discovered — and his actual PhD background was in transport systems in plants and he sort of transplanted that to transport systems in rivers — and realized that about 90 percent of what’s delivered down our rivers happens during about 10 percent of the year, on average, during high flow.”
From there, the NCWQR and its staff would begin to specialize in monitoring the transport of nutrients through streams. And a rich history would start to take shape, one resulting in what researchers all around the Great Lakes know and value as the Heidelberg Tributary Loading Program, an incredibly useful tool in the fight to fix the current Lake Erie algal bloom problem.
But that is not all that the Center’s staff work toward. There are many other initiatives they support, including the Cooperative Private Well Testing Program that provides low-cost water quality tests for anyone in the United States with a well. The Center also runs a website, lakeeriealgae.com, to educate people about the issues faced there and what’s being done. Other works include studies looking at the health of macroinvertebrate communities in Ohio streams and Lake Erie, as well as large efforts to model watersheds throughout the state to determine different methods that farmers can take to clean up runoff flowing off their lands.
Stream Monitoring

Rock Creek, which flows alongside Heidelberg University’s campus. (Credit: Daniel Kelly / Fondriest Environmental)
During our visit to the NCWQR, we had a chance to tour a sampling station located on Rock Creek, which flows right by the university. From there, we got a behind-the-scenes look into how all the samples moving through the Center get analyzed.
The Rock Creek station is much like the many other stations that the Center helps to manage throughout the state of Ohio. According to the most recent total, there were 18 stations in all, with one located in Michigan.
And not all are created equal: Some are bigger or smaller than others, including the tiniest site, which sits on an unnamed tributary of Lost Creek near Farmer, Ohio.
“Just a little, tiny creek they put a little weir in to be able to get flow measurements that we need to go with the concentrations that we get,” said Boehler. “And this one is slightly special in that we have two samplers set up in here so that the data logger, when the stage gets above 1.75 (feet), it trips this sampler to kick on and it takes samples every two hours. So when it’s really raining, we get more samples.”
As Boehler describes the setup at the Rock Creek station, he notes that many of the others in the network are set up the same way, with ISCO automatic samplers at their core. Within each, there are plates to hold plastic sampling bottles. As a water tube spins around, bottles get filled up one by one.
“So that’s where we are now. Back in the day, students collected samples with a bucket and a bottle and we lowered it down from a bridge,” said Ewing. “(They) brought it back to the lab, we did manual chemistries where everything was colorimetrically analyzed but it was all done by hand.” That type of processing began to change in 1974, she says, when work in the lab began to be automated with the help of machines like colorimetric analyzers and ion chromatographs.
Of course, before the samples can be analyzed, they have to be collected. That’s where Boehler and Ewing, who makes sampling runs with Research Assistant Barbara Merryfield, focus a lot of their efforts. And there isn’t a break — they are out collecting samples no matter the season or the weather.
Boehler’s route, like the other, is every Monday. Gathering samples essentially involves driving to a station and swapping a new, empty base of bottles into a sampler and retrieving the base containing the previous week’s samples. The two routes cover the stations within reach, but there are two sites that rely on the help of volunteers who gather samples every day and send them in. Unlike the automated collection at most sites, the work in these streams is done using old-fashioned buckets lowered off of bridges.
“The Cuyahoga, Muskingum, Scioto and Great Miami (Rivers) are all that same way where someone actually goes to our site, whether it be grabbing a sample with a bucket or automatically like one of our stations and they just ship them to us then in coolers,” said Boehler.
The volunteer who helps out on the Muskingum River has been doing it since the 1990s and takes the duties seriously. He has gotten into his eighties, but sends in samples reliably for the Center.
“He was very apologetic because he had to miss a little bit because he had a knee replacement,” said Ewing. “And even then he had his wife go out and do it for him.”
But similar care goes into processing all the samples, as well as keeping stringent quality control checks to ensure that the data produced are accurate and useful.
“If you read any protocol for doing dissolved reactive phosphorus, you’re supposed to analyze it within 48 hours. That’s impossible to do and do the type of intensive sampling that we do,” said Ewing. “So within the base, there’s this special bottle (that we leave). And so bottle No. 24 and bottle ‘SX10’ are going to be filled at the same time on Monday. Bottle No. 24 is going to come back here and be analyzed immediately or within 48 hours. That SX(10) bottle in the middle is going to stay out there for a week. And we will then compare the values we got for the fresh sample versus the values that we got for the stored sample so that we can then back up the quality control on our data and try to assuage some of those people who tell us that we can’t do this because we’re beating, or exceeding, holding time.”
Data Analysis

Bottles sit inside an automated sampler. (Credit: National Center for Water Quality Research)
Back in the lab, analyzing samples is such a big job requiring so many machines that viewing the processes to someone unfamiliar (certainly us that day) is like taking a tour of a fast-moving industrial factory. But instead of the crew you’d expect, all the workers are well-trained scientists and produce data instead of goods.
Walking through the third-floor lab housed in Gillmor Science Hall on Heidelberg’s campus, there are big machines and small machines. Contraptions on long tables feature circulating glass tubes, filled with liquids colored blue (for total phosphorus) and orange (for total Kjeldahl nitrogen). Some rooms are filled with sampling bottles, while others hold more machines. These are used for the tributary monitoring program while others support the well testing program.
Common equipment includes colorimetric analyzers, ion chromatographs, filters and balances for weighing, which we’re told was one of the first things to get automated in the lab.
“We literally send the weight into a program that takes care of keeping track of all of that information in addition to sample location, sample bottle, volume filtered and all of the assorted pieces of information that we need for this,” says Ewing. Thousands of weighings are done each year, she says, given the magnitude of the sampling operation.
One of the machines used is a Seal AA3 analysis system. It evaluates ammonia, dissolved reactive phosphorus and silica. From there, we moved on to a large area dominated by ion chromatographs where Merryfield demonstrated a typical sample run.
“The idea behind this is we have our sample. It’s been prepared in whatever fashion it needs to be prepared, and we then add sample and reagent,” said Ewing, pointing out the spinning glass coils pushing through colorful blue and orange. “Wherever there’s a fitting, there’s either a reagent or sample that comes into the system. The glass coils, you can see them still tumbling, because this was actually finishing running. That’s acting as a mixing chamber and so the idea here is that we have the two meet, mix, may heat it may not, depending on the chemistry.”
From that point, scientists take a look at the color that is produced. The darker the color, or the more intense that a color is, the higher the concentration. Merryfield shows us on a computer screen how one of the peaks in a line graph is edging upward. The peak moves higher, indicating the strength of the concentration. This process is repeated for hundreds of samples, Ewing says.
“The idea behind these chemistries is steady state. So we add reagent and mix until we get no further color production,” said Ewing. “So this is a very classic peak. You want to see that peak flatten off and maintain.”
We venture down the hall to a solutions prep room and from there to a trace metals room containing a big, boxy machine called an Inductively Coupled Plasma Mass Spectrometer. It is an important piece of equipment for the well testing program, which has processed more than 90,000 samples for private well owners around the United States over the years.
“In the late ‘80s, we started a well-testing program through funding with the (Ohio) Farm Bureau where they actually would, basically, pay most of the cost for people around the area and turned it into the whole statewide program,” said Boehler. “And now I think we’ve done 37 or more states, well samples from different states where they send us a sample and we process them for metals and these are things like arsenic, calcium, magnesium, things you can use to figure out your water hardness.” The total number of metals they screen for is about 20.
The program has yielded some useful information for well owners. Roughly 10 percent of the wells that come through the program have been found to have some sort of structural deficit. What that means, typically, is that problems people find with their wells, and water, are due to poor construction or the integrity of the well’s structure. Examples of this include ruptured casing from a lightning strike, or fractured bedrock nearby that lets surface water penetrate.
In addition to the regular chemistries on the well water, the Heidelberg crew also does a couple pesticide screens. These cover the water-soluble forms that are most commonly used today, like atrazine and alachlor.
How Data Are Used

Ellen Ewing talks about methods and equipment used at the National Center for Water Quality Research. (Credit: Daniel Kelly / Fondriest Environmental)
Data from the Heidelberg tributary monitoring network are used in a lot of ways. They have been a primary source of conclusions drawn by researchers studying Lake Erie’s western basin and its algal blooms for some time, but that is not the only purpose they serve.
For insight into some of the ways that all the findings get used, we talked with Ken Krieger and Laura Johnson. Krieger has recently retired as the Center’s director and Johnson has assumed the role beginning in 2016.
Our conversation was wide-ranging and not altogether linear, but we learned about prominent trends reflected in datasets collected by the Center over the course of the previous year. And we dug into some of the implications the numbers have for the years ahead as well as continued monitoring in the Great Lakes region.
“We’ve found lots of things in our long-term dataset. The biggest finding has been that dissolved phosphorus, dissolved reactive phosphorus, has been increasing pretty drastically since the mid ’90s. It’s increased and then it’s sort of leveled off,” said Johnson. “And because we see them in the Maumee River, which is one of the main inputs into Lake Erie, we’re attributing that increase to the recurrence of algal blooms that we’ve been seeing since about 2003.”
There are nuances there, Johnson says, and notes that most of the metrics that they show are reported on an annual basis, including yearly loads and concentrations. But when trying to relate the size of the blooms that are seen in Lake Erie to what’s coming out of the Maumee River, the most important time of year to focus on is the spring.
More specifically, nutrients that make it into the lake from the beginning of March through the end of July seem to have the most impact on the size of the algal blooms. This knowledge has helped scientists at the Center to contribute to a forecasting system, which was created by the National Oceanic and Atmospheric Administration, for the size of the bloom each summer.
Timing is important for that, but so are the nutrient loads. And when it comes to dissecting those, you can parse them out in different ways. Those from point sources have not gone up to coincide with the recent return of algal blooms from the mid-1990s, while non-point sources seem high depending on the year that you look at.
“Sometimes they’re more equivalent, but what you’re really missing when we look at total phosphorus is we don’t have a good explanation for why algal blooms have returned,” said Johnson. “And so it’s not until you actually look at the dissolved phosphorus component.”
There is a downward trend in particulate phosphorus, Johnson says, while there is an increasing one for dissolved phosphorus and that makes total phosphorus appear to have little change. Still, only a little more than 20 percent of total phosphorus is dissolved, while the rest is mostly particulates that algae can’t use. Much of that settles out before it can make it to Lake Erie anyway, so the details of all the figures are important in knowing what factors are at play in algal blooms.
“Our founders decided to measure dissolved phosphorus even though the water quality measure for phosphorus is usually total phosphorus,” said Johnson. “They added that in since the very beginning. It’s always been there.”
But what about nitrates? That’s been monitored by scientists at the NCWQR from its beginning too. Krieger tells us that nitrates coming from the watersheds they monitor in, particularly agricultural ones, are down from what they were in the early 2000s.
“There was a general increase until about 2000, 2002, and since then, there’s been a general decline,” said Johnson. The average for the Maumee River has gone from 7 milligrams per liter in 2001 down to 4.5 milligrams per liter in 2014. And that’s not huge, but it is substantial. “They’re (farmers) getting higher yields because of new varieties of corn and, which is what they needed nitrogen for, and they’re more efficiently using nitrogen. So they’re not applying that much more but they’re getting a lot more yield, and so it seems like there’s a possibility we’re seeing this response in terms of nitrogen just in advances in crop technology.”

Jake Boehler describes the function of a mass spectrometer used for the National Center for Water Quality Research’s well testing program. (Credit: Daniel Kelly / Fondriest Environmental)
For all rivers across the state with agricultural land use, there is a reliable period on which to bet that a nitrate surge will appear in the data and that is right around the planting season’s first big rain event. In that way, nitrate spikes can almost be used as a tracer for agricultural activity.
Other researchers are studying nitrogen’s role in the toxicity of algal blooms. The decreasing trends that the Center’s data show may very well support the idea that there’s more to it than just nitrogen. It’s well established that phosphorus drives the size of the blooms, Johnson says. And so toxicity isn’t something that could solely be associated with nitrogen loads, but the levels are high enough that they could influence toxicity. The concentrations could also have effects on the future composition of algal species in Lake Erie.
“If nitrate keeps going down and phosphorus keeps staying up, that might have a big effect on what we see in the future,” said Johnson.
Beyond nitrogen and phosphorus, a lot of work is done to monitor suspended sediments in tributaries. These efforts date back to a time prior to the second phase of the Great Lakes Water Quality Agreement wherein farmers and land managers were trying to turn soil over less often, put in buffer strips and promote conservation tillage as ways to reduce the sediments that made it into Lake Erie.
The idea for those actions was also benefited by the fact that they would probably help to reduce the loss of particulate phosphorus, which they did. Seeing the patterns is a little more difficult, Krieger says. But he notes that the quantity of water that’s flowing through rivers like the Maumee and the Sandusky has increased quite a bit since the 2000s and there are much higher average flows than there were back in the 1980s.
So if you’re considering something like suspended sediments or particulate phosphorus, the erosive capacity of rain events can push those higher. But add in the effects of good management practices, and something else comes to light: There can still be high flows that push sediment concentrations higher, but those concentrations are still lower than they were for a similar flow event back in the 1980s.
“But then we see something else in terms of dissolved phosphorus. Everywhere we look (in agricultural watersheds), the dissolved phosphorus has gone up,” said Krieger. “The proportion of dissolved phosphorus to all the phosphorus, what we call total phosphorus, has increased.” These changes have come about since 1995, and they’re owed to changes in the sizes of farms, how fertilizer gets applied and increases to the intensity of precipitation in the area.
And there are still other things that the Center’s staff have tracked over the decades. One you might not expect is silica, something that we confused with sand.
“Silica is a component of sand, at least the type of sand in non-volcanic regions,” said Krieger. “And so it’s a component of glass and diatoms basically have glass shells, which is what makes them heavy and they tend to sink.”
But why would you want to monitor something like that? Well, think back to the decision to track dissolved reactive phosphorus even though it wasn’t a typical thing to track. There is always a good reason for collecting data, or at least a good scientist can give you one.
“Of course the diatoms are taking all that (silica) up,” said Krieger. This is because they use it to form their shells. He adds that diatoms grow like crazy in colder temperatures and cites a Bowling Green State University study that is looking into how they behave in the winter. “They have to be playing a big role in the dead zone in the central basin because they’re going to settle out, go to the bottom and decay just like the bloomers, cyanobacteria, do too. So there’s a winter, maybe fall through spring, component of the algal cycle nobody’s really paying much attention to which is not causing a problem in the western part of the lake but might be causing part of the big problem in the central basin. There’s just a lot of dynamics going on.”
The insights that researchers at the Center have gained over the years are considerable. And all of them are proof of the worth of their efforts and the tributary loading network because there’s no way that one or two stations would provide all the information resource managers need to know.
“We get the question: ‘Why do you need to keep monitoring year after year? You’ve done this for 30 years already,’” said Krieger. “Well, it’s because we’ve done it for 30 years that we can see these things.”
Watershed Modeling

Sampling station on the Sandusky River. (Credit: National Center for Water Quality Research)
So far, we’ve talked about a lot of data collection. But an important question is how the data actually get used in attempting to solve the problems that they help to quantify.
To get some insight into that side of things, we talked with Rem Confesor, senior research scientist at the National Center for Water Quality Research who is heading up efforts to model the hydrology of watersheds that impact water quality in Lake Erie. In addition, he is working with other modelers around the state to launch a new program to compensate farmers for the nutrient runoff reductions they achieve.
Confesor’s work applies much of the understanding that the Center has gained over the years in a modeling approach to make improvements in the real world.
“We’re basically trying to understand the problem, trying to understand the processes for what causes the problem. So the purpose of the modeling actually is, given all the limited understanding of the problem, what can we do?” said Confesor. “So this is the solution side really, so we’re not just identifying the problem and just analyzing the trends or the cause but I think my task is to test implementing the solutions at this time with the limited knowledge that we have.”
What most watershed models do is take into account conditions like terrain, slope and elevations along with those relating to properties of the soil throughout the region being considered. So things like soil type, depth, its chemical properties and its bulk density (soil weight in a given volume key to its ability to support root growth) get plugged in.
Weather is another important consideration, as the model can’t really move without it. Inputs like falling rain and snow are forces that drive the model’s behavior, Confesor says. The movements of nutrients like phosphorus are impacted by those flows, as well as other things like crop cover. From there, things get even more detailed.
“It can actually identify if it’s urban or if it’s forested and if it’s agriculture,” said Confesor. “If it’s agriculture, it can … identify if it’s corn, soybean or wheat.” For each crop, the model considers the cover, when it is planted each year and the different agricultural practices used in the process.
As an example of modeling capability, Confesor pulls up the Nutrient Tracking Tool online, a computer program developed by scientists at Tarleton State University and in part by the U.S. Department of Agriculture’s Natural Resources Conservation Service. It is a useful platform for farmers who want to consider changing up their farming practices to get different results. What’s great about it is that it can zero in on specific land parcels across the country. Just enter an address and you’re ready to go.

Two water quality sondes sit inside a water tank at a sampling site. (Credit: National Center for Water Quality Research)
From that point, users can enter the sort of treatments that they currently apply to their lands, like choice of fertilizer, the crops planted and land management approaches used, like crop rotation. And then it’s possible to consider what might happen if they adjusted things by inputting that info too.
“For example, this is your actual fertilizer, or tillage management system. So you just don’t plow, you don’t apply fertilizer,” said Confesor, pointing out fillable information boxes in the tracking tool. “This is a type of planter or something like that. And then you plow again for soybeans (as an example). So you’re using conventional tillage. And what if you copied that alternative but this time changed it so there’s no tillage? So what’s going to be the difference?”
Though using the tool can be difficult for some, Confesor says that it at least provides an easy way to compare the effects of different approaches, like tilling or not tilling.
But looking at actions taken at the field scale is fairly simple when compared to considering those over a larger land surface, such as an entire watershed. So that is where most of the difficulties come in, like accounting for activities of all the tiny farms existing in a much bigger region.
“So that’s the main problem with scaling up from the field scale to the watershed scale,” said Confesor. “It’s still the challenge of what’s going on in between the small farms as it flows to the outlet of the watershed.”
But the end goal, of course, is better management approaches that can help land managers while also helping farmers who are growing food for all of us on limited budgets. Toward that end, Confesor is working on a project that would push a pay-for-performance approach that could reduce nutrient runoff while keeping farmers’ crop yields steady.
He is working with an international nonprofit and local soil and water conservation districts to set up the new kind of program.
“For example, instead of the government subsidizing the farm as to implement the BMP (best management practice), it’s not sustainable because if the money’s gone the farmers will not stick to it. That’s always the case,” said Confesor. “So what we do is that for several farmers in a small watershed, we can identify, using the help of the soil and water conservation district people, a small watershed and identify the farmers and ask them to participate in that program where we will use this field-scale model to calculate what’s going on in their farm.”
The next move is to set up an alternative management scenario that the farmers could use on their land. One key, though, is that farmers would keep the freedom to choose how they want to implement the best management practice. Once the BMP is put in place, Confesor and others can rely on edge-of-field monitoring devices, in-stream samplers and modeling to assess how well each practice is doing.
“We will just estimate with the model the reduction. So based from that reduction in pollutants and the actual year of the farm, we will have some kind of a rule or calculations that we would pay the farmer, whatever the reduction is,” said Confesor. “And the more reduction we have, it could be possible that they have reduced the exports and they have at the same time increased their yield — we’re still going to pay them. It’s based on their performance actually, not on what the government tells them to do. And I think that’s what they want.”
Top image: A staff gauge tracks Tiffin, Ohio’s Rock Creek’s water levels. Its water is pumped out for sampling through a pipe. (Credit: Daniel Kelly / Fondriest Environmental)
3 Comments
Leave a Reply


Jim Amon
March 4, 2016 at 4:00 PM
Daniel- The article got me thinking about urban/suburban watersheds. It would be useful to understand how developments such as those growing in the Beaver Creek and Little Beaver Creek watershed (Greene Co, OH) are contributing to the nutrient loading in our groundwater. This is of great concern for drinking water and for the groundwater that feeds the Beaver Creek Wetlands Fens. Do you know of anyone looking at that kind of information?
Daniel Kelly
March 8, 2016 at 9:33 AM
Hi Jim, thanks for your comment. I know of a few folks at Wright State looking at the Lower Great Miami’s nutrients. And there is a NCWQR stream monitor on/near one of the Great Miami’s tributaries. But I don’t know of anyone in particular who is looking only at nutrients around the Beaver Creek Wetlands. That sort of data would be very useful.
Pingback: Lake Erie Algal Bloom Forecast - Lake Scientist