Chloride Contamination Threatens Thousands of Northeast & Midwest Lakes
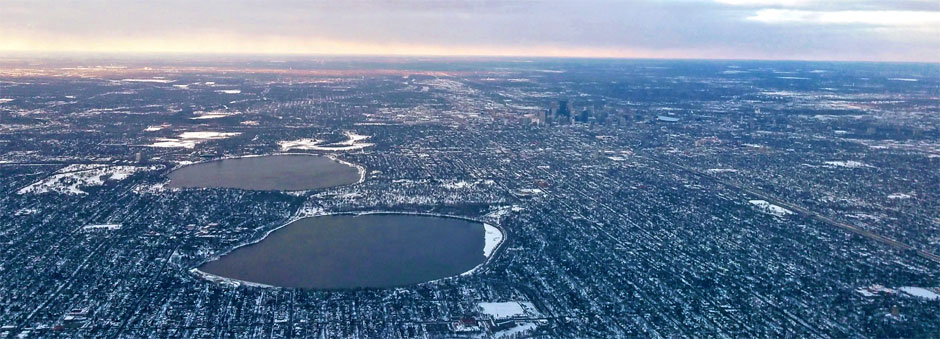 Bde Maka Ska, a lake in Minneapolis, Minnesota, included in the study. The lake displays elevated and rising chloride levels over time. Credit: F4fluids / CC BY-SA
Thousands of lakes in the northeastern United States are at risk of chloride contamination.
In a 17-state area from Minnesota to Missouri to Maine, elevated chloride levels in some of the region’s nearly 50,000 lakes are driven largely by landscape features that are cleared of snow and ice by road salt in the winter.
“The biggest driver of increasing chloride concentrations in these lakes was road density and development. The more developed a watershed, the more likely you are to have roads and parking lots,” said Hilary Dugan, an assistant professor in the Center for Limnology at University of Wisconsin—Madison.
Dugan is the lead author on a study examining the issue recently published in Environmental Science and Technology. It uses existing records to model the extent of chloride contamination throughout the region.
Predicting chloride contamination
After their previous research showed increases in chloride in lakes throughout the 17-state region, Dugan and much of the same team shifted their focus to the geographical extent of chloride contamination.
“Instead of looking at chloride through time, we tried to look at chloride through space,” Dugan said. The goal was to build a “predictive landscape model.”
Dugan and team built a model using data from the National Land Cover Dataset and water quality data from the U.S. water quality portal.
That model identified predictors of elevated chloride levels and identified 1,972 lakes across the region with chloride levels at or above 50 mg L-1, a good sign of anthropogenic inputs of chloride, Dugan said. The greatest predictors of elevated levels were the ways land is used near lakes and in their watersheds.
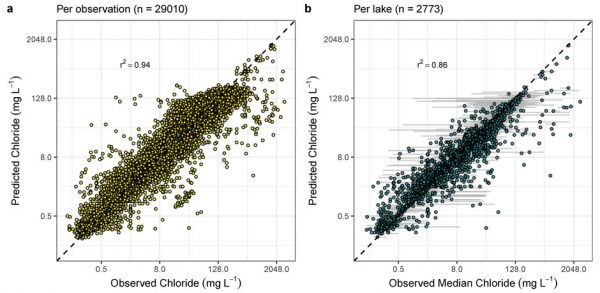
Predicted vs. observed chloride in lakes in the 17-state area. Reprinted with permission: Hilary Dugan, Nicholas K. Staff, Jonathan P. Doubek, et al. Environmental Science & Technology, June 1, 2020.
Roads and development mean road salt in the winter. Salt runs off roads and into lakes.
“Our use of road salts is such a huge component of anthropogenic salt inputs that it kind of dominates the signal,” Dugan said.
Recent data from the United States Geological Survey suggests that over 20 million metric tons of salt were spread on American roads in 2019, commonly in the states in the study.
Three of the four strongest predictors for elevated chloride levels, proximity to an interstate highway and low-density and medium-density development in the watershed, suggest road salt usage as a significant source.
(Low and medium density development areas include areas like suburbs where winter salt usage is likely to be high.)
The fourth, density of cropland, points to the use of certain synthetic fertilizers like potassium chloride. Five million tons of potassium chloride are used on crops each year.
The United States imported seven million metric tons of potassium chloride in 2016, according to the United States Geological Survey.
However, the chloride contributions of road salt can be an order of magnitude higher than that from fertilizer, the study notes.
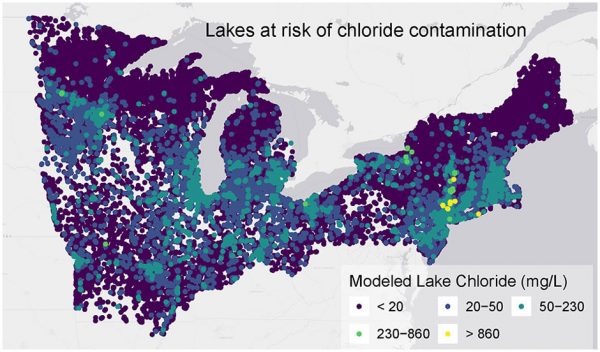
Predicted chloride levels in nearly 50,000 lakes in 17 states. Nearly 2,800 lakes were at risk for chloride contamination. Reprinted with permission: Hilary Dugan, Nicholas K. Staff, Jonathan P. Doubek, et al. Environmental Science & Technology, June 1, 2020.
Sodium chloride levels a call to monitor
The study sets a chloride contamination risk threshold at 50 mg L-1. That number doesn’t relate to any official federal or state standard.
The United States EPA sets the criterion for continuous concentration of chloride in freshwater at 230 mg L-1. In Wisconsin, it’s 395 mg L-1. New Hampshire sets the maximum four-day average at 230 mg L-1. Canada’s national standard for long term chloride levels, which governs lakes adjacent to the study region, is set at 120 mg L-1.
Chloride standards vary even within states and for surface water or drinking water.
“It’s nearly impossible to provide one single number that indicates whether you’re polluting a system that’s causing damage to that ecosystem,” Dugan said. “At the same time—while I say it’s nearly impossible to do—we have to do it.… Share on XFifty milligrams per liter is a conservative standard compared to national and state standards in the region, but lakes that exceed it almost certainly are feeling the impact of humans.
“If your lake has a chloride concentration of more than 50mg L-1, you definitely have human impact on it. There’s a very small likelihood it’s a natural concentration. In most cases it’s probably ten, twenty-fold higher than it should be,” Dugan said. “This is an area you should monitor.”
Filling holes with monitoring and research
Dugan says ongoing and future research could benefit from increased monitoring of chloride levels across this region. A better record going forward could help researchers understand the effects of elevated chloride levels on aquatic species, identify long term trends and create opportunities for collaborative mitigation efforts between researchers and those who use road salt: both public officials and private citizens.
Though the water quality concerns of increased chloride levels are gaining more attention, many states had little or no observation data, Dugan said.
Six states in this region reported chloride levels for zero or one lake.
These gaps could be filled with a relatively simple conductivity measurement.
“There are pretty straightforward ways of getting this data,” Dugan said.
More data would flesh out sparsely measured areas and catch more spikes in chloride levels throughout a year, something average chloride levels don’t accurately measure. Scientific understanding of chloride levels in these lakes could move from the realm of prediction to that of empirical measurements.


0 comments