Clearing the Air: Insights into New York’s Air Quality Monitoring Network and Strategies
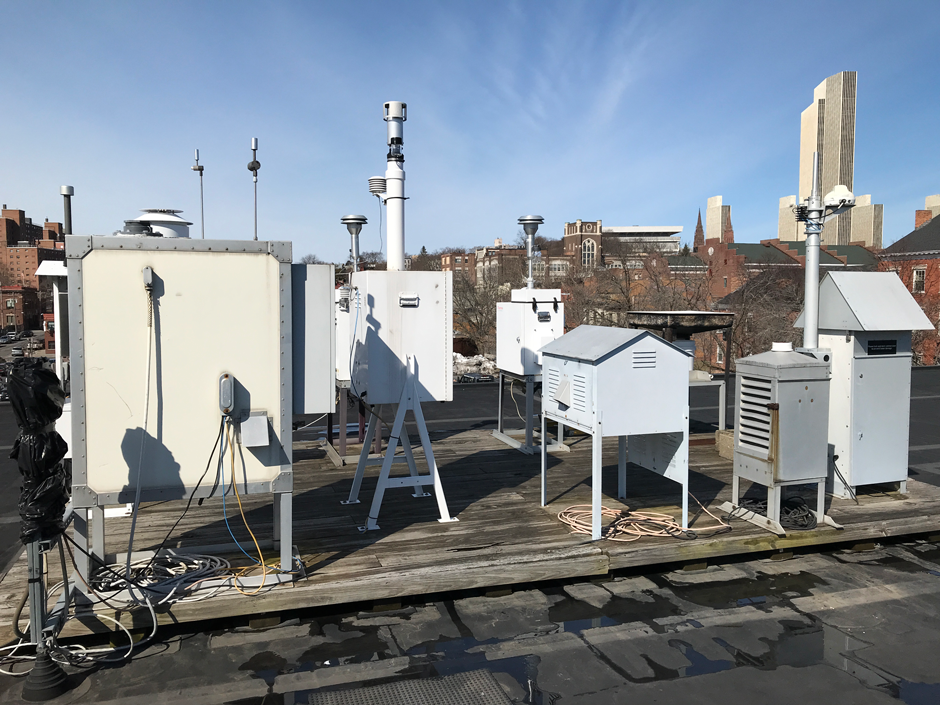 Rooftop air monitoring site with DEC and DOH equipment. (Credit: NYSDEC)
“AIR QUALITY ALERT” warnings dominate television screens across the U.S. as pollen counts climb and air pollution worsens. While stories cautioning against people going outside and increases in air contaminants skyrocket mostly during the summer, air quality monitoring occurs year-round and has been for decades.
Dirk Felton, a research scientist with the New York State Department of Environmental Conservation’s Division of Air Resources, has been monitoring air quality and pollution since 1994. During his time with the NYSDEC, Felton has worked on the state’s complex air quality monitoring network. The collection of systems assess particulate matter (PM-2.5 and PM-10), carbon monoxide (CO), lead (Pb), nitrogen dioxide (NO2), ozone (O3), sulfur dioxide (SO2) and air toxics—all of which influence air quality and can be hazardous to human health.
How Air Pollution is Monitored
Air pollution is monitored through several EPA standards that are intended to not only protect the environment but also public health. Felton explains, “Every five years the EPA revises, reviews the current standard and decides if the current published literature regarding health effects of pollution warrant an increase, or a decrease in the current level, instrumentation or monitoring network design.”
He continues, “When that’s published as a final National Ambient Air Quality Standards (NAAQS) we have to respond accordingly, and either modify our monitoring network and the type of instruments that are approved for that network, and produce data that are acceptable, so that we know that the air quality is meeting standards for the people in New York.”
The NYSDEC has 50 stations statewide that monitor air pollution, a dozen or so of which are part of the state’s Air Toxics Program. Most of these systems are continuous and integrated with real-time technology, but half of the PM monitors are filter-based, requiring more frequent maintenance. The live PM-2.5 and ozone data gathered by the system is used to create the air quality index and provide visibility to the public.
Felton explains, “Our network provides hourly data statewide from more than 40 of the sites and that data goes to our website, as well as to the EPA’s AirNow database.” Both resources are available to the public, and the AirNow database allows people to track the movement of pollution across the country.
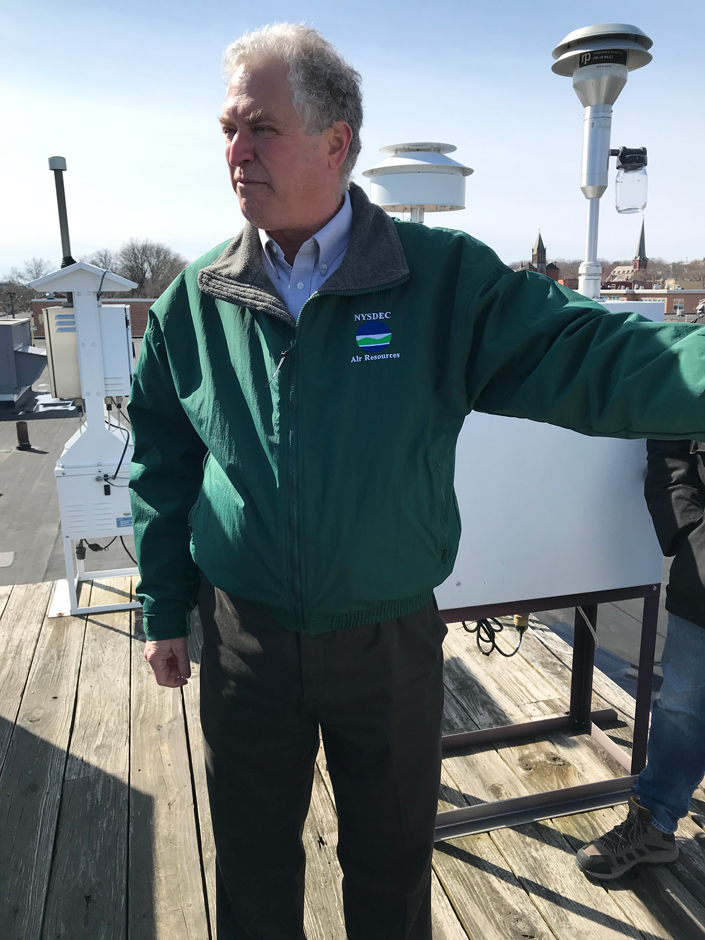
Dirk Felton with PM-2.5 OCEC speciation sampler on his right and PM-2.5 on his left. (Credit: NYSDEC)
Each station is comprised of different equipment depending on the needs of the surrounding area. The equipment and stations also depend on whether Federal Reference Methods (FRMs), Federal Equivalent Methods (FEMs) or a combination of the two are being used. Methods include the use of filter analysis, continuous PM analyzers, ozone monitoring, gas analyzers, ultra-fine particle counters, continuous formaldehyde monitoring and auto-system gas chromatography.
When air quality declines as a result of ozone episodes caused by photochemical reactions between volatile organic compounds and other emissions, including NO2 in the atmosphere, or wildfire smoke, as was the case recently, there is little the NYSDEC can do to control the event once it’s begun. Even with control strategies and various prevention strategies, air quality events may still occur, and according to Felton, “The one thing we can do is track it.”
The sources of particulate matter can be speciated through specific equipment that measure things like black carbon. Looking for indicators of wildfire smoke and wood smoke can help provide more information on where the state can improve their control strategies as well as seeing how close they were to attainment, excluding the event.
Why Monitor Air Quality
Air pollution can have long- and short-term impacts on human health, making the live data gathered by the NYSDEC air quality monitoring system highly valuable for people hoping to protect themselves. Ozone primarily affects the lungs, while PM 2.5 can impact the lungs and cardiovascular system. The system allows the NYSDEC to forecast air quality and gives people a visual to help them decide when to go out and exercise during a certain time of the day or choose a different day.
The standards specified in the NAAQS exist in order to protect human health. As the impacts of pollution become better understood, the standards adjust to reflect the latest research. Organizations like the NYSDEC also adjust as time goes on, implementing newer and more precise monitoring equipment and control strategies to limit pollution.
When the PM-2.5 Program first began, levels exceeded EPA standards in parts of the state, but over time, air quality has improved. Statewide, New York meets the NAAQS threshold for PM-2.5, but potential reductions in acceptable levels may mean that the state will need to update its network and current control strategies. Parts of New York are not in attainment of the ozone NAAQS including New York City, Long Island and the lower Hudson Valley.
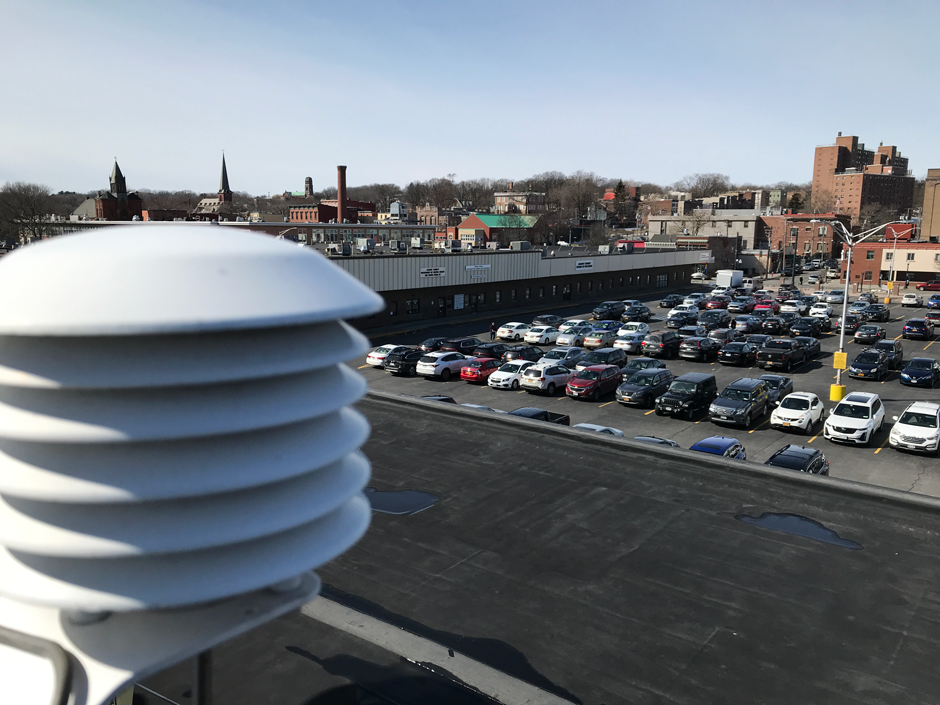
Ambient temp probe for the FRM sampler. (Credit: NYSDEC)
The attainment area New York is responsible for extends beyond the state’s borders—”You can have an [ozone] episode that starts in Maryland and goes up through New Jersey and through New York City, and then head to Connecticut—because Connecticut is part of our ozone non-attainment area, we’re responsible for those levels in Connecticut, because we’re contributing to them,” states Felton.
Pollution originating from other states or countries can also influence New York’s attainment of NAAQS standards. The wildfire smoke that traveled from Canada and blanketed the region in smog will have an impact on the state’s daily and annual levels despite the state being unable to control the pollutant.
The multi-state nature of the ozone problem makes it all the more difficult to solve. Felton elaborates, “It’s not something that we can just figure out precisely what to control and put a stop to it. We have to work on strategies for a long time, and there’s a lot of new research focusing on this particular problem.”
Conclusion
As air quality monitoring programs become more advanced, the EPA seeks to optimize systems and unify data from across the country. Felton says that one of the major changes happening is that the EPA is working to create an algorithm that will be installed in the firmware of PM-2.5 instruments to make results more consistent from one instrument vendor to another.
For years, states may have had some bias in comparison to neighboring states due to differing instrumentation, making the direct comparison between state attainment levels difficult. “We’re sort of in a new era where the EPA is looking at the warts of the system and saying, ‘you know, we could improve upon this instrument,'” explains Felton.
“I think PM 2.5 is fascinating [. . .] It’s important that they’re responding to the health impacts of this—and they’re saying that we need to continue to lower the standard to keep people healthy,” states Felton. Since 1970, the PM NAAQS have been revised many times to reflect current research and knowledge surrounding health and air quality. PM-2.5 monitoring started in 1999 and the EPA is looking to update the current standards once again.
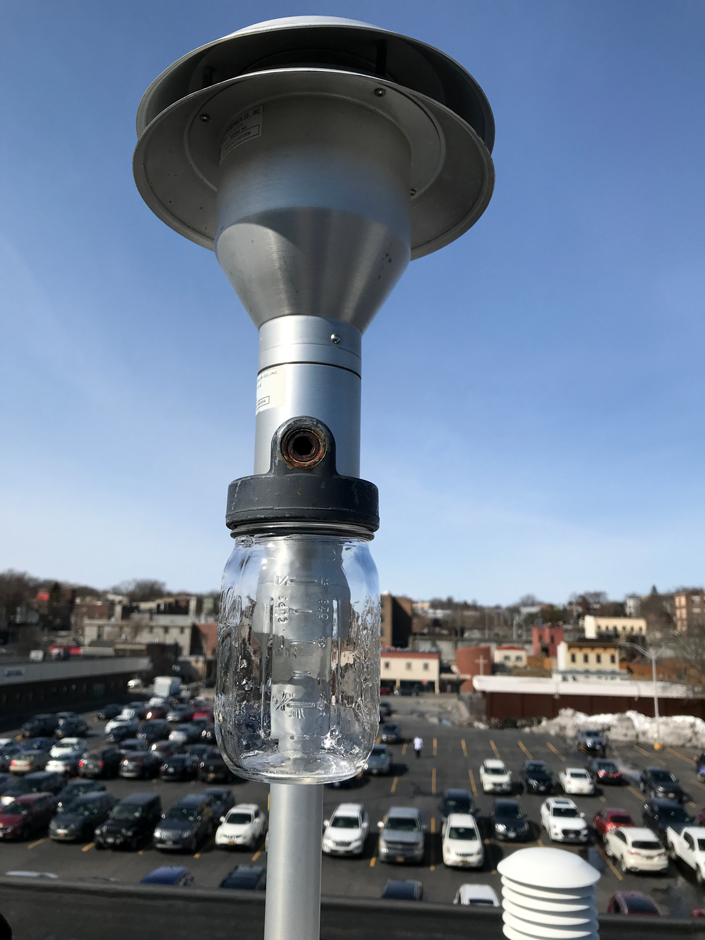
PM-10 inlet (Credit: NYSDEC)


0 comments