Extreme Wave Heights, Ocean Winds Increasing Globally
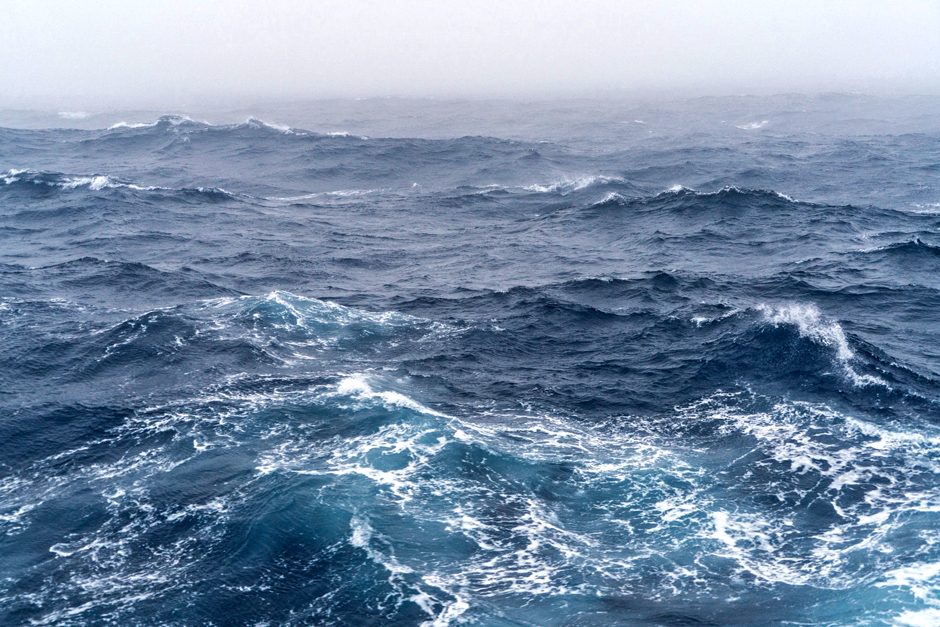 The Southern Ocean, Drake Passage (Photo Credit:Christopher Michel [CC BY 3.0 (https://creativecommons.org/licenses/by/3.0)])
Around the world, extreme wave heights and ocean winds are increasing. The greatest increase is happening in the Southern Ocean, according to recent research from the University of Melbourne, and Dr. Ian Young corresponded with EM about what inspired the work.
“Our main interest is ocean waves, and we are interested in wind because it generates waves,” explains Dr. Young. “Ocean waves are important for the design of coastal and offshore structures, the erosion of beaches and coastal flooding, and the safety of shipping.”
Waves also have a role in determining how much heat, energy and gas can be trapped in the ocean.
“The major reason why changes in wave height may be important is because of sea level rise,” details Dr. Young. “People are concerned about climate-induced sea level rise because of associated coastal flooding. However, over the next 100 years, storms will still be the biggest cause of coastal flooding. Sea level rise will increase the frequency and severity of these floods. If wave heights are increasing this will impact the erosion of beaches, the extent and frequency of coastal flooding.”
Comparing data over decades
In order to determine how wind speed and wave heights might be changing over time, the team looked at data collected between 1985-2018 by 31 satellites—about 4 billion observations. Then, the team compared those observations to measurements taken by over 80 data buoys deployed around the world.
“Although we now have many more satellites in orbit, the basic systems they use to sense wind and waves has remained very stable,” Dr. Young describes. “We went to enormous efforts to calibrate every one of the 31 satellites we used against ocean buoys to ensure they gave consistent measurements over this time. We also analyzed the data in a variety of different ways to ensure there was no bias caused by the fact that the number of satellites in orbit has changed over the years.”
To calibrate the data coming from the satellites using the network of 80 oceanographic buoys, the team looks at what are called satellite “matchups.”
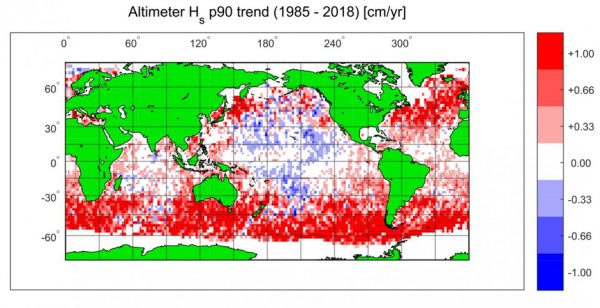
Global trends in extreme (90th percentile) wave height over the period 1985-2018. Areas in red indicate increasing values, whereas blue indicates decreases. (Credit: Professor Ian Young, University of Melbourne, https://www.eurekalert.org/multimedia/pub/199093.php?from=427795)
“When a satellite flies over a buoy and both measure at the same time, it’s a ‘matchup,’” states Dr. Young. “This allows us to calibrate the satellite. We use lots of buoys to ensure our calibration dataset is very large. We also validate the calibration by looking at spots where two different satellites fly over the same patch of ocean at the same time. This way we can ensure they are producing very similar results.”
With data from more than 80 buoys and 31 satellites, the team is presenting conclusions based on the biggest, most detailed dataset of its kind.
Extreme waves and winds
The team found that all of the world’s oceans have become more stormy over this period, but the Southern Ocean has experienced the most increase in extreme wind speeds and wave heights. In fact, extreme winds in the Southern Ocean have increased by 1.5 meters per second, or 8 percent, over the past 30 years. Over that same time period, extreme waves have increased by 30 centimeters or 5 percent.
“The key issue is whether these increases will be sustained into the future—this is when we will start to see real impact on coastlines,” remarks Dr. Young. “Even small changes in wave conditions can be important for beach erosion.”
Interestingly, not just the magnitude of the waves, but also their mean originating direction, is changing.
“This can be very important for beach stability,” comments Dr. Young. “Our beaches are generally in equilibrium with the waves. If the wave direction changes we can see very large erosion of the beach as things are no longer in equilibrium. The beach wants to re-align to the new wave direction.”
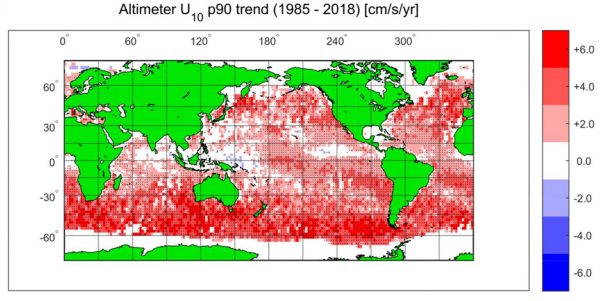
Global trends in extreme (90th percentile) wind speed over the period 1985-2018. Areas in red indicate increasing values, whereas blue indicates decreases. (Credit: Professor Ian Young, University of Melbourne, https://www.eurekalert.org/multimedia/pub/199093.php?from=427795)
In terms of how we think about coastal living and development in the future, Dr. Young sees this work as another piece of the potential sea level rise puzzle.
“We need to understand that coasts are dynamic systems,” says Dr. Young. “If the waves that shape these systems change, then the coast will also change. This means we need careful planning with an understanding of coastal environments.”
Along these lines, international groups are refining the satellite systems the team used in this research to obtain even more accurate measurements.
“The European Space Agency is funding a major international project to reanalyze all of this data from the very earliest missions,” Dr. Young adds. “This will process the data at a more basic level than we were able to conduct. Although we went to great effort to build a consistent dataset, it has its limitations. The new processing should result in an even more precise and consistent dataset than we had available.”
Dr. Young also stresses the need to develop a better understanding of how much of this change is due to long-term climate change and how much is due to multi-decadal oscillations like ENSO, Pacific Decadal Oscillation, and the Southern Annular Mode.
“As we have a dataset that is only 33 years long, we need to be careful if there are very long term periodic oscillations,” explains Dr. Young. “Imagine if you had an oscillation with a period of 20 years and we measured for 30 years. We would see 1 and a half oscillations. This could easily be interpreted as a trend when it is just that we have only sampled the oscillation for a short period.”
The team is continuing data analysis to look at these effects. Meanwhile, the results raise the question of whether it is that storm intensity is increasing or the frequency of storms is increasing—or both.
“We can’t tell this from our data because of the way the satellites sample,” details Dr. Young. “The only way to get this sort of information is from computer models. As yet the coupled climate/wave models are not good enough to give reliable estimates for extreme conditions. However, as our computing resources increase we will be able to address these issues.”
Moving forward and trying to answer these questions, Dr. Young sees the value of a longer-term dataset.
“The most important thing is for us to continue to maintain these buoy networks,” comments Dr. Young. “They are expensive to maintain, so there is always a desire to scale them back. Funding agencies ask why we need buoys now that we have satellites in orbit. The answer is we need the buoys to calibrate the satellites. The satellites can then give us much more data.”


0 comments