Floating, Diving Robots in the Southern Ocean
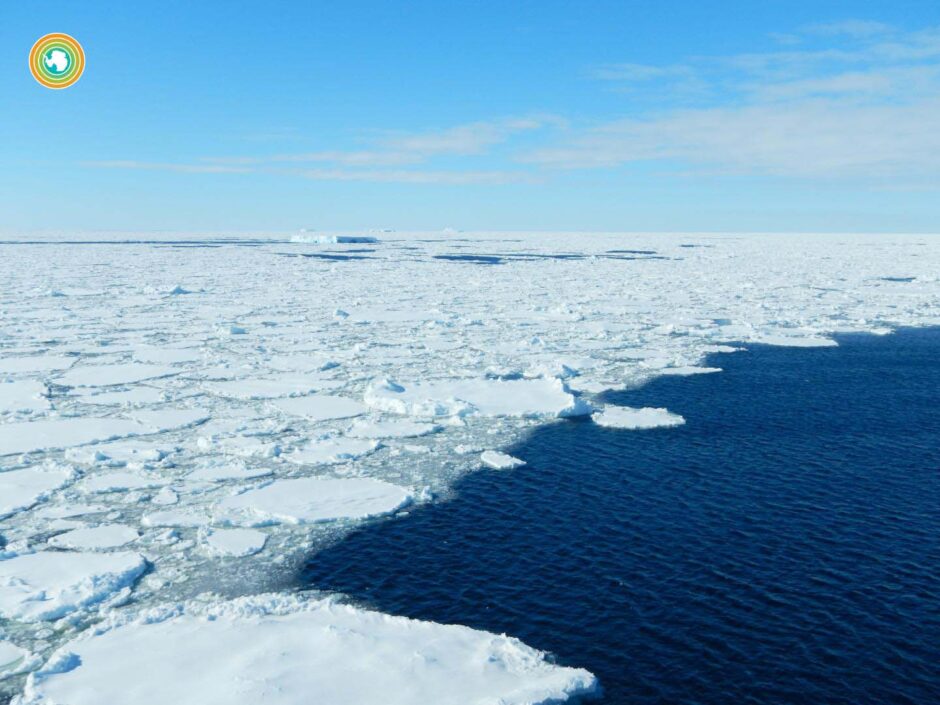
Data captured by the floats show outgassing near the edge of the Antarctic sea ice. This photo was taken in January, during the Southern Ocean summer, when the floats were deployed. The higher-than-expected outgassing was seen in the stormier winter months. (Credit: Hannah Zanowski/University of Washington/Flickr, https://www.eurekalert.org/multimedia/pub/178050.php?from=402838.)
The polar regions of the world have always a challenge for scientists to explore and study. Even logistics that are typically no more than passing concerns under other circumstances such as transportation become major problems during polar wintertime. Now, researchers are reporting on their use of hundreds of oceanic floats that are drifting and diving their way through the Southern Ocean, including under its ice, with surprising results.
Happy robotic wanderers
EM spoke with Dr. Alison Gray, assistant professor of physical oceanography at the University of Washington, to find out more about the work, the robots, and the significance of the findings in improving our understanding of the global climate and this poorly studied region.
“My background is in using data from these types of instruments,” explains Dr. Gray. “There’s a larger global array, the Argo array, composed of the same type of instruments that measure temperature and salinity. There are about four-thousand of them in the global ocean, and this has revolutionized our understanding of ocean circulation, temperature, salinity and the physics of the ocean.”
During Dr. Gray’s post-doctoral work, they began to study these Argo instruments and install additional sensors on them in the Southern Ocean. These new sensors monitor dissolved oxygen, nitrogen, and pH in addition to the standard Argo parameters of salinity and temperature, and they adorn the floats the team is now using on the current project.
“The floats are measuring temperature and salinity, and they also kind of give us an estimate, just based on their location, as to how they are moved about by currents in the ocean,” details Dr. Gray. “That also gives us an estimate of the velocity of the ocean, of the currents. So those measurements happen concurrently with all of the other measurements, that data gets sent to the regular Argo system, and then we get five other variables that are being measured.”
The robots each take their own unique, random path in the water, drifting with currents and adjusting their buoyancy to make observations at varying depths. The floats eventually surface, and transmit their observations via satellite to the team on the shore.
“They just wander,” remarks Dr. Gray. “They spend about 95 percent of the time at 1,000 meters beneath the surface, so whatever the ocean is doing controls. Some of the floats don’t go far at all; you deploy them and they hang out in one location. Some of them really move a large distance over the course of their lifetimes. So each one really has its own trajectory, its own lifetime, and its own story to tell.”
Controversial results
The study itself is a collaboration between Dr. Gray at the University of Washington and teammates through Princeton University’s Southern Ocean Carbon and Climate Observations and Modeling (SOCCOM) project, the Monterey Bay Aquarium Research Institute, and other oceanographic research organizations.
“I was lucky enough to be involved with the project from the beginning,” comments Dr. Gray. “The first float that we deployed went out in the spring of 2014, and then every year we’ve added more floats. After we got about a year’s worth of data from the initial set of floats that went out, I started looking at the carbon flux, and we realized what we were seeing was very different from the previous estimates of carbon uptake in the Southern Ocean. That was obviously very intriguing, and we really worked hard the next few years to really ensure we were confident in our results, and analyze multiple years of data. Eventually, we found a striking difference with the previous estimates of the carbon flux in that region.”
Conventional wisdom concerning the Southern Ocean, which is south of the 35th parallel, at about the tip of South Africa, indicates that it takes up a significant amount of carbon, and plays an important role in the carbon cycle of the planet.
“If you think of all the carbon that’s been emitted by human activity since the beginning of the Industrial Revolution, about a quarter of that has gone into the global ocean, and about half of that quarter has been taken up in the Southern Ocean,” Dr. Gray states. “That’s sort of what our best estimates are, so even though it’s remote and most people never think about the region, it is actually having a big impact on the global climate.”
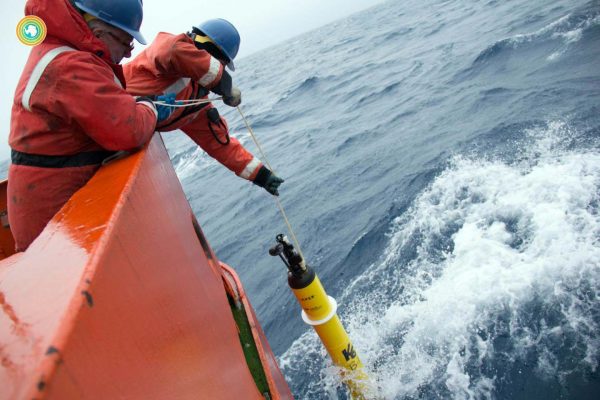
Stephen Riser (left) drops a float into the Southern Ocean during a 2016/17 cruise. (Credit: Greta Shum/ClimateCentral, https://www.eurekalert.org/multimedia/pub/178051.php?from=402838)
However, the results the team produced were significantly different than what researchers have estimated in the past.
“We only saw a very significant difference with the previous estimate in one fraction of the Southern Ocean: that area that is typically covered by sea ice during the winter, radiating outward from Antarctica,” explains Dr. Gray. “Previously we thought this region had a net zero carbon uptake. But with our float-based estimates, we were able to see that in winter there’s a whole lot of outgassing. The ocean is emitting carbon into the atmosphere in this region, and that led to an annual net difference that is significant. By our estimates, the whole Southern Ocean goes from being a large uptake for carbon of about 0.9 or 0.8 petagrams of carbon per year to something like 0.1.”
This surprising result has triggered a skeptical reaction in some, “Because it’s a big change in our understanding,” adds Dr. Gray. “There are multiple explanations for the change, and probably some of each are in play here.”
However, the team is certain that annual variability in previous estimates is not enough to explain the difference in the results.
“There is significant variability in the carbon uptake in the Southern Ocean; we do see that even from ship data going back decades, we see these big swings,” remarks Dr. Gray. “But the difference that we’re seeing is still outside of the range of that variability, so we think that year to year changes can’t explain it. We think what was probably happening was that our previous estimates that were based on shipboard data were missing this wintertime outgassing that’s really significant, and because of that they were biased.”
The team used new technology to get the results, but they also monitored a different parameter. Instead of directly measuring dissolved CO2 in the water as they would from a ship, the floats monitor pH levels, allowing the team to estimate the carbon levels based on the pH.
“That said, it certainly is based on fundamental carbonate chemistry,” clarifies Dr. Gray. “But there are some uncertainties that go along with that, in contrast to if we were to directly measure it, and we do definitely take that into account. Even taking into account those uncertainties, the difference we find is significant.”
Understanding Earth’s most hostile areas
The floats deployed in this project are enabling a much more robust understanding of the Southern Ocean, something that has repeatedly proven difficult or impossible for researchers to do without technological assistance.
“The Southern Ocean is one of the least well-sampled areas in the whole world, because it is so far away and so unpleasant, basically, to be there in the wintertime,” comments Dr. Gray. The team continues to process the data—and form a stronger, clearer picture of outgassing in the area.
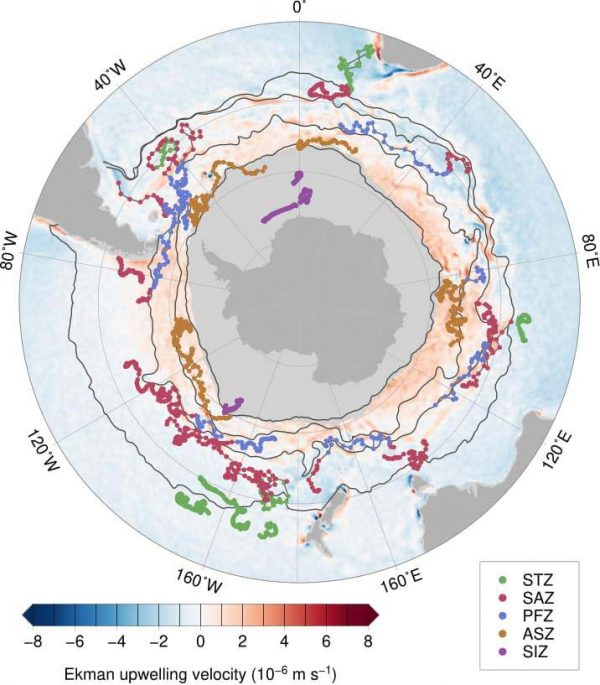
This shows the robots’ paths around Antarctica. Dark gray is land, and light gray is sea ice. Instruments colored dark orange in the ‘Antarctic Southern Zone’ found higher-than-expected outgassing of carbon dioxide. (Credit: Alison Gray/University of Washington, https://www.eurekalert.org/multimedia/pub/178052.php?from=402838)
“The data are still coming in, but we expect to get about four years of data from each float, and we’re continuing to do put out more with the goal of getting about 200 of them deployed over the course of the lifetime of the project,” states Dr. Gray. “So it’s still ongoing research, and we’re still teasing apart the data, but I think people are becoming more and more convinced.”
In some ways, Dr. Gray says the results shouldn’t seem all that shocking.
“We do already know that in this region the deep water that was isolated from the atmosphere for a long time is reaching the surface water again,” explains Dr. Gray. “So we expect there to be a lot of carbon in this water, we just underestimated the magnitude of the outgassing.”
With this difference established, the team will work to answer other questions.
“If this particular region is emitting all this carbon that we were previously not accounting for, where is that missing carbon going? asks Dr. Gray. “Our estimates of atmospheric carbon concentrations are very robust, so we’re not hiding any carbon in the atmosphere.”
The likely explanation, according to Dr. Gray, is that it’s going into the ocean in a different place than previously thought. Another possibility is that our understanding of what’s happening with terrestrial ecosystems is off.
“If it’s happening somewhere in the ocean, it’s still likely that those things would be happening in the southern hemisphere somewhere, just further to the north,” Dr. Gray describes. “But we also have very few observations from the southern hemisphere subtropical oceans. So certainly using this kind of technology and expanding to global coverage makes us more likely to capture what’s happening on a global scale.”
Next for the team and others using the data, may simply be expanding our understanding of what’s happening under the wintertime ice—now that we finally have the opportunity.
“We’re getting very new and exciting data because a lot of the floats are basically taking data under the ice during the winter and that, in particular, is something that we’ve never been able to see before,” details Dr. Gray. “So we’ll be continuing to understand the data and analyze the role of the Southern Ocean and how it impacts the global scale carbon cycle.”
“There are many different uses for this kind of data, and having it all out there, people discover new applications for it that you don’t even think of yourself; that’s really the great value of the data set and a strong argument for collecting it,” adds Dr. Gray.
Top image: Data captured by the floats show outgassing near the edge of the Antarctic sea ice. This photo was taken in January, during the Southern Ocean summer, when the floats were deployed. The higher-than-expected outgassing was seen in the stormier winter months. (Credit: Hannah Zanowski/University of Washington/Flickr, https://www.eurekalert.org/multimedia/pub/178050.php?from=402838.)


0 comments