Global ocean acidification maps show stress caused by carbon emission absorption
Global maps created by a team of scientists show, for the first time, a sweeping picture of the acidification of the planet’s oceans as a result of human carbon production, according to a release from Columbia University. The global maps are a new standard against which ocean acidity data can be measured in the future.
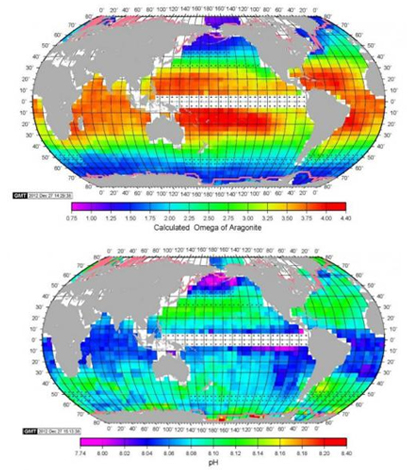
Signs of stress have already appeared in many marine populations coinciding with the increase in acidity, most notably coral reefs. For example, aragonite, a mineral used by shell-building organisms like coral, is present in lower concentrations in seawater when acidity increases, impacting coral reef health. The new global maps clearly show that the areas closer to the Earth’s poles have the lowest levels of aragonite-saturated water, as well as more seasonal variation of aragonite, suggesting of shell-building animals will struggle the most there.
Top image: New global maps give a better look at ocean acidification. (Credit: Taro Takashi)


0 comments