
Great Lakes tributary monitoring sets baseline for restoration gains
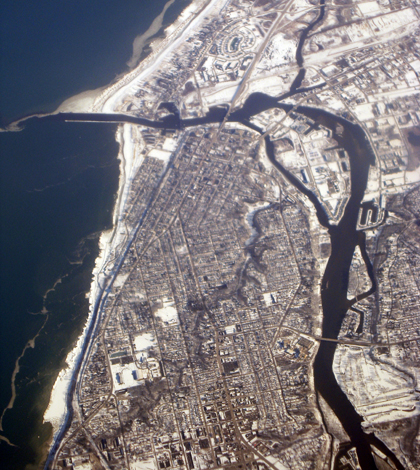
The St. Joseph River is among the Great Lakes tributaries tracked by the network (Credit: Doc Searls, via Flickr)
In the early 2000s, a coalition of environmental agencies and stakeholders was tasked with developing a template for a Great Lakes tributary monitoring network, though it wasn’t given the funding to put much into practice. Today, thanks to a lot of planning and a little luck, the equipment is installed and the network has two years of data collection under its belt.
Political will behind protecting the nation’s coasts from environmental degradation led Congress to direct the National Water Quality Monitoring Council to design a National Monitoring Network to keep an eye on water quality along ocean and Great Lakes shorelines.
Not long after a plan for the network was in place, along came the Great Lakes Restoration Initiative, a federally funded program with millions of dollars earmarked for environmental monitoring.
“It was kind of serendipity that the National Monitoring Network design was completed shortly before the Great Lakes Restoration Initiative was announced and started coming into fruition,” said Dan Sullivan, a supervisory hydrologist with the U.S. Geological Survey’s Wisconsin Water Science Center. “We were basically able to put in practice in the Great Lakes what we considered to be the best design for a monitoring network. It’s a pretty unique opportunity.”
The design includes monitoring stations on 30 tributary rivers across the Great Lakes basin. Each station went in at the site of a USGS streamflow gauge and is equipped with automated water samplers and multiparameter water quality sondes.
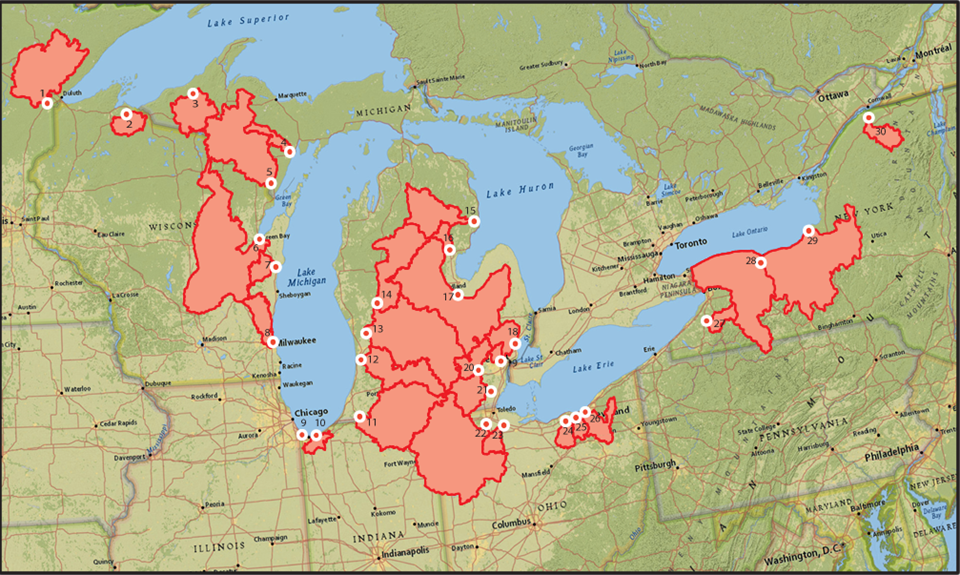
The tributary monitoring network covers 30 of 59 sub-basins identified by the National Monitoring Network (Credit: USGS)
The automated samplers are programmed to start filling bottles with water from the stream at regular intervals when the stage or velocity reaches a particular level. The automation makes sure the samples capture the higher nutrient, sediment and contamination levels associated with the runoff of a storm event.
“We put in the automatic samplers because it’s always though to get out to a site and physically sample it (during a rain event),” Sullivan said. “What you end up doing 95 percent of the time is missing that rise and then you just collect the down side of the event, and there’s a lot less going on then. You miss the highest loads.”
The samples are eventually collected and sent out for lab tests for levels of various forms of nitrogen and phosphorous, as well as suspended sediment concentrations.
Each site is also equipped with a water quality sonde recording temperature, dissolved oxygen, turbidity, pH and specific conductance every 15 minutes. USGS scientists are working on developing statistical relationships between those parameters and nutrient concentrations derived from the water samples.
“That way we’ve basically got a pretty good, real-time estimate of what those concentrations are,” Sullivan said. “What that will also allow you to do is cut back on the water sample analyses to reduce those costs and man-hours in the field.”
At eight of the 30 sites, another automated sampler collects 24-hour, filtered composite samples that are tested for mercury, viruses and a suite of wastewater related compounds. At these sites, a fluorometer is collecting continuous measurements of CDOM that will let scientists build a similar statistical relationship between that parameter and concentrations of mercury and other contaminants for real-time estimates.
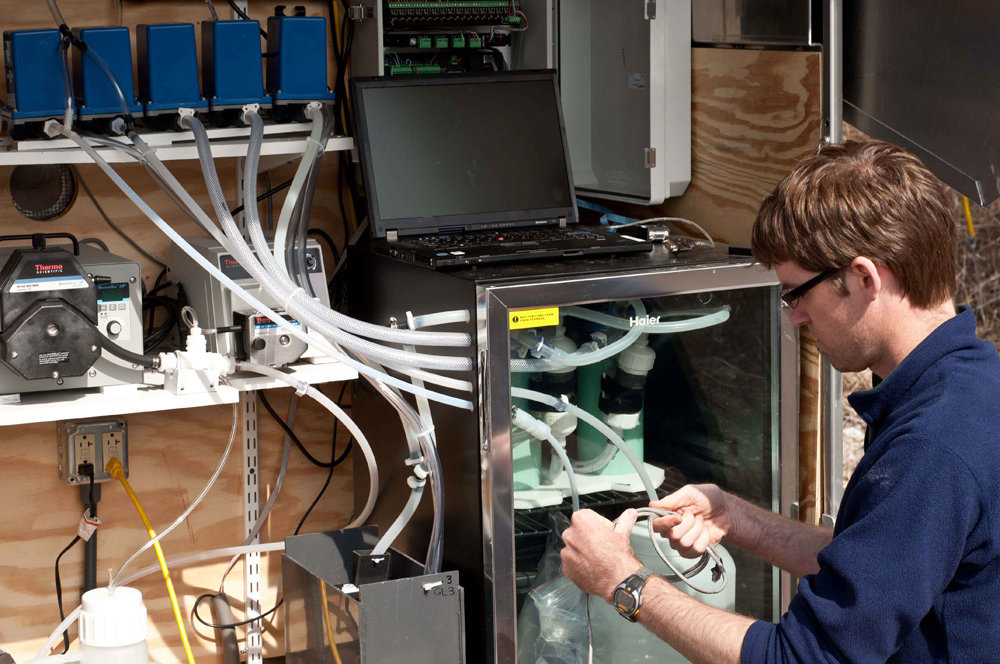
A scientist works in the sampler setup for a virus monitoring station (Credit: USGS)
With two years of data in hand, Sullivan said a series of reports is in the pipeline. Some of those will provide a snapshot of water quality conditions during the early years of the Great Lakes Restoration Initiative that could serve as a baseline comparison for whether the program’s efforts lead to improvements down the road. Others will report research methods, like those associated with tying real-time water quality parameters to nutrient and loads.
The funding cycle supporting the network ends in September 2015, and the longevity of the program is tied to future installments of the Great Lakes Restoration Initiative funding.
“As we’re doing the data analyses here, the folks that are doing that are pretty excited about what we’re learning,” Sullivan said. “So hopefully that will continue.”
Top image: The St. Joseph River is among the Great Lakes tributaries tracked by the network (Credit: Doc Searls, via Flickr)


0 comments