
Great Lakes Wetland Map To Help Scientists Tackle Losses
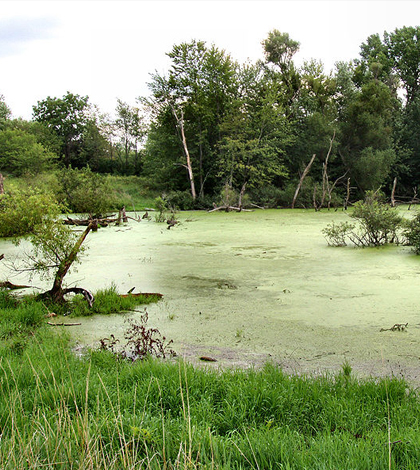
Great Lakes wetlands are being comprehensively mapped for the first time. (Credit: Derek Jensen/CC BY 2.0)
The Great Lakes region has lost more than 50 percent of its coastal wetlands over the past century. The losses have meant decreases in water filtration, as well as degradation to important habitats.
To mitigate future losses to the Great Lakes, scientists at Michigan Technological University’s Research Institute developed a comprehensive map of all the basin’s wetlands. The map, based on satellite data, builds on previous maps built at the research institute, like those covering invasive species, to help protect the Great Lakes.
“There is a need to have current maps of location, extent and landscape context for managing and monitoring the coastal wetlands of the Great Lakes,” said Laura Bourgeau-Chavez, research scientist at Michigan Tech and leader of the effort to develop the map. “Existing maps were outdated or inconsistent across political boundaries.”
Before the map was put together, researchers searching the National Wetlands Inventory could only find maps covering wetlands on the United States side of the basin. And those dated back to the 1970s and 1980s, says Bourgeau-Chavez.
The new map clears up those issues and establishes a standard from which other researchers can begin. Inconsistencies of the past impacted data analysis, says Bourgeau-Chavez, but the basin-wide map now available is extensive enough to eliminate those problems.
Satellite data provide the foundation of the coverage map, as researchers used information collected by synthetic aperture radar. Those were the best choice because satellites using that technology can distinguish between flooded ground, the structure of vegetation and its mass, and also soil moisture.
But the work involved more than pulling together images. Bourgeau-Chavez and others had to grapple with the limitations of satellite technology that wasn’t ideal for all measurements.

A map generated using the Great Lakes wetland mapping tools developed at Michigan Tech Research Institute. (Credit: Michigan Technological University)
“Open water is the easiest feature to model, but there is confusion in other classes that have similar spectral signatures in Landsat and those that have similar backscatter in the PALSAR (radar) imagery,” said Bourgeau-Chavez. “Using both types of sensors (radar and optical) and multiple dates of imagery helps to reduce a lot of the confusion, but there are still some features that get confused and teasing those apart was challenging at times.”
For example, there is one type of sparse wetland plant that can’t be picked up by optical sensors alone. And using the radar imagery was still introducing error when researchers tried to measure it over water. The solution was to filter the map so that it showed the plant only on areas where there were ground data to verify its presence and then to show other areas as water where it was least likely to be.
Scientists also had to deal with distinguishing peatlands from wetlands, the interconnectedness of waterways, as well as integrating zones like agricultural areas and urban landscapes into the map.
But scientists had something on their side to help solve the issues that came up: good field data, which they collected using standard devices like cameras, GPS units and notebooks.
“We used geolocation devices, GPS cameras, laminated air photos of each of the field locations to take notes on, tape measures and field sheets to quickly circle site characteristics,” said Bourgeau-Chavez. Those include things like ecosystem type, vegetation density as well as water depth.
All the work went into a first-of-its-kind map that has already become a valuable tool to scientists in both the U.S. and Canada.
“Many researchers and land managers have downloaded the maps and are using them to aid in planning restoration efforts, transportation corridors, field studies, etc.” said Bourgeau-Chavez.
The maps will need to be updated within 5 years to keep up with changes occurring to coastal wetlands in the Great Lakes, she says. And the satellite data used in her effort, from the PALSAR satellite mission, won’t be available then. It ended in 2011 and provided satellite scenes for about $100 each. The next mission, PALSAR-2, is led by commercial parties who plan to charge $3,000 for each scene.
Support for the mapping project was provided by the Great Lakes Restoration Initiative through a grant from the U.S. Environmental Protection Agency.
Top image: Great Lakes wetlands are being comprehensively mapped for the first time. (Credit: Derek Jensen/CC BY 2.0)


0 comments