Mapping Trends in Open Surface Water Bodies in the US
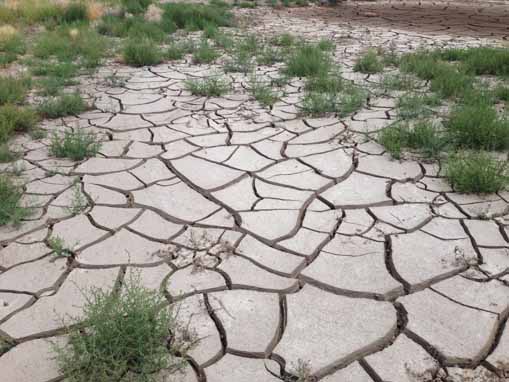
Drying and cracking mud at the intersection of Nevada State Route 361 (Gabbs Valley Road) and Nevada State Route 844 (Ione Road) near Gabbs, Nevada, 2014.(Credit: By Famartin [CC BY-SA 4.0])
By September of 2011, the Southern Great Plains of the United States had been in the grip of an intense drought for months. Crops withered in fields as water supplies dwindled and failed and wildfires raged and destroyed farmland, wilderness areas, and homes. The fall forecast that year didn’t look much better; La Niña had come, bringing below-normal precipitation and above-normal temperatures with it. There was little relief in sight.
2012 wasn’t much better. Over that baking summer, much of the US suffered through the worst drought in 50 years, with low harvest rates in the Midwest taking place earlier than ever before. Food production was at a low, and so was the Mississippi River. Even the news that Hurricane Isaac was moving inland came as something of a relief to many in the Midwest, who were hoping for a respite from the relentless drought.
These events inspired researchers from the University of Oklahoma (OU), led by Professor Xiangming Xiao, to undertake a data mining and big data research project, mapping trends in open surface water bodies in the contiguous US (CONUS). Their aim was to detect any trends in surface water levels, which are so critical for agriculture, public water supply, biodiversity, industry, and the ecosystem more generally.
Making sense of the data
Professor Xiangming Xiao, a professor of ecology and remote sensing in the Department of Microbiology and Plant Biology in OU’s College of Arts and Sciences, corresponded with EM about the research.
“The variability of surface water resources is an indicator for assessing the impacts of drought,” explains Professor Xiao. “This research was driven by three scientific questions and curiosity: (1) What were the spatial and temporal variability and trends among open surface water bodies? (2) What factors have driven that variability and those trends? (3) What changes in that variability are likely in the future?”
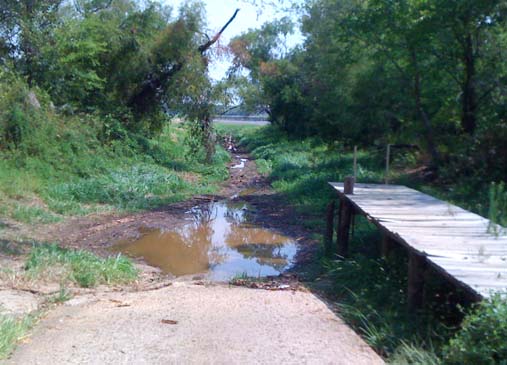
A public boat launch on Lake Palestine in Henderson county, Texas during extreme drought conditions. On average, water levels would be approximately 1-2 feet below the short pier seen at right. (Credit: By Buddpaul [CC BY-SA 3.0])
Next, the team quantified the interannual variability of surface water bodies over the last three decades in states across the contiguous US. They found that most States in the dry regions of the Southwest and Northwest exhibit significant decreasing trends, while many States in the wet regions of Southeast and far north Great Plains have significant increasing trends.
“We thought these divergent trends had increased the surface water resources gaps across the US, which could have big effects on the economy and local ecosystems,” remarks Professor Xiao. “We carried out some attribution analysis for potential driving factors. Based on multiple regression analyses, precipitation seems to be the major factor driving these divergent trends over the past three decades.”
Therefore, based on existing climate projections, the team believes that the Southwest will become dryer and experience more severe droughts as climate change continues; this should aggravate existing levels of water stress in these regions in the near future.
“In short, we thought that reporting what we found would help the water resource managers and stakeholders have a better understanding of the water resource conditions in terms of their variability and trends,” adds Professor Xiao.
New life for existing data
One of the compelling things about this research is that it is another great example of putting existing data to powerful new uses, combining it with extensive new ancillary data and innovative applications.
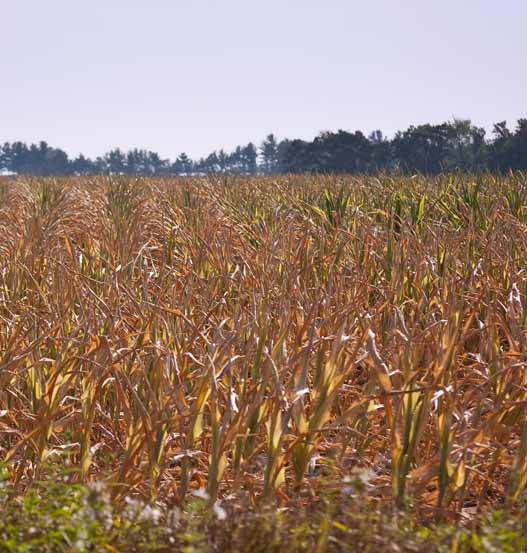
Iowa County Drought July 2012. (Credit: By WxMom, Flickr: Iowa County Drought [CC BY-SA 2.0])
The team also made use of existing data. They used water body maps from the Joint Research Center (Pekel et al., 2016) for inter-comparison. They accessed surface water withdrawal data from USGS (USGS, 2010), and climate data from NOAA (NOAA, 2017) for attribution analysis. In addition, to prove that the interannual variations found in the surface water body dataset closely mirrors the actual situation, they used the Gravity Recovery and Climate Experiment (GRACE) land water storage data from the NASA Jet Propulsion Laboratory (JPL).
As climate change causes more (or less) precipitation in different places, both surface water and groundwater will be affected through recharge and discharge. Water quality will also be impacted.
“In areas where rainfall increases, the reservoirs, lakes, and rivers will maintain high water levels, and large water body area for a longer time each year,” Professor Xiao describes. “More freshwater brought by the additional rainfall will increase the water cycle and dilute the concentrations of dissolved organic and inorganic matter, which may lead to improved water quality.”
Unfortunately, the trends this research reveals may have more somber implications in arid regions.
“In simple terms, the shrinking of surface water body area in the western US identified in our research indicates the decreasing of surface water availability in these regions,” remarks Professor Xiao. “Considering the unfavorable climate projections, increasing water use efficiency is likely to remain a high priority for both environmental authorities and local industries.”
The team’s product, annual water body frequency maps and 33-year water body frequency maps of the contiguous US, is now open to the public at the public database of Zenodo: https://zenodo.org/record/1194516#.WveUjdMvzBK
One Comment
Leave a Reply


Pingback: Mapping Trends in Open Surface Water Bodies in the US - Lake Scientist