Measuring Rising Floodwaters with the USGS
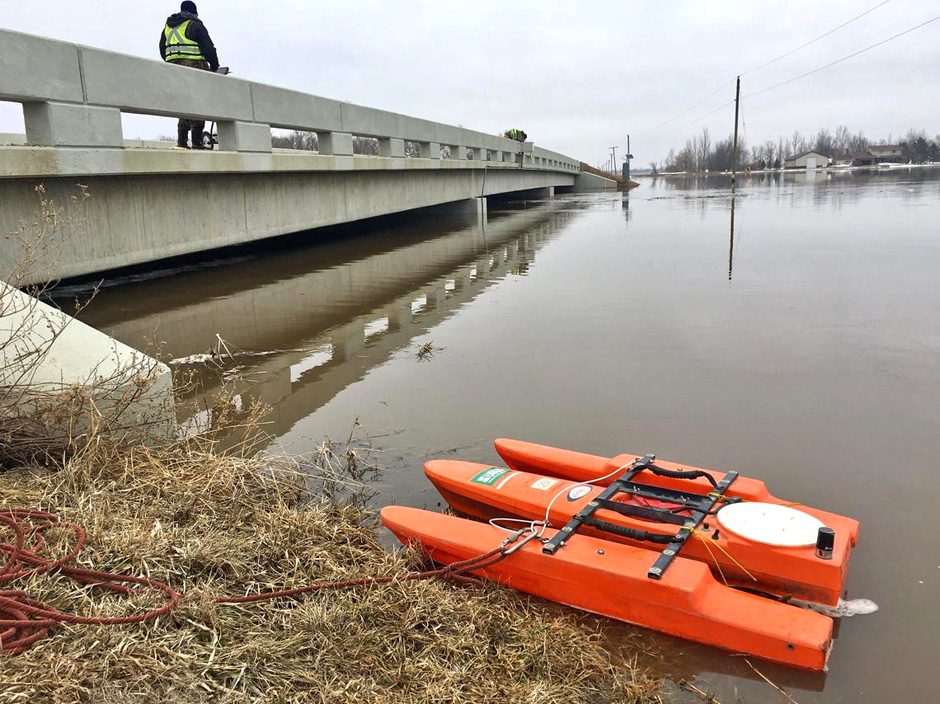 A USGS crew prepares to measure streamflow during record flooding on the Maple River near Mapleton, ND, on April 6, 2019. The instrument pictured is an acoustic Doppler current profiler which measures streamflow as it's dragged across the water. (Credit: Marisa Lubeck, USGS. Public domain.)
All year long the US Geological Survey (USGS) in North Dakota and South Dakota monitors water levels, but during times of flooding, all eyes are on the team. EM spoke to USGS data chief Chris Laveau about the monitoring efforts.
“The US Geological Survey in North Dakota and South Dakota is one entity, so we monitor the flooding in both states,” explains Mr. Laveau. “The role is to provide continuous information on water level, we call that gauge height or stage, and we also provide continuous information at a lot of locations on stream flow, typically called discharge. We do that year round but, obviously, during a flood event it garners more attention.”
During a flood event, the USGS is the agency that is out on the landscape taking measurements on flow, and verifying how high the river is.
“We share that information with other agencies, such as the National Weather Service (NWS), who take it and forecast how high will the river get,” details Mr. Laveau. “USGS, on a regular basis, is the agency that operates the stream gauging network, and during a flood event we continue to do what we always do with a ramped-up intensity, making sure that all of our data is accurate and shared in a timely manner with all other emergency managers and forecasting agencies.”
The USGS operates stream gauges all over the nation, ensuring consistent and accurate data, and a cost-effective way to provide flow and level information—and the data also happens to be relevant during flood season.
“The flow in the river is what a lot of agencies or entities are interested in, so our stream gauges provide real-time information about river levels, and we’re able to relate that to flow through a stage-discharge rating,” Mr. Laveau describes. “During a flood, we’re out there constantly calibrating that rating to make sure nothing’s changed, so when we say the river is this high, and there’s this much flow, we’re as accurate as we can be. Then that information on flow gets fed into models used by river forecast centers and they try to predict how high or low the river’s going to go in the future during a flood.”
It’s not easy to predict flooding, and once the USGS collects its data, that part is someone else’s task.
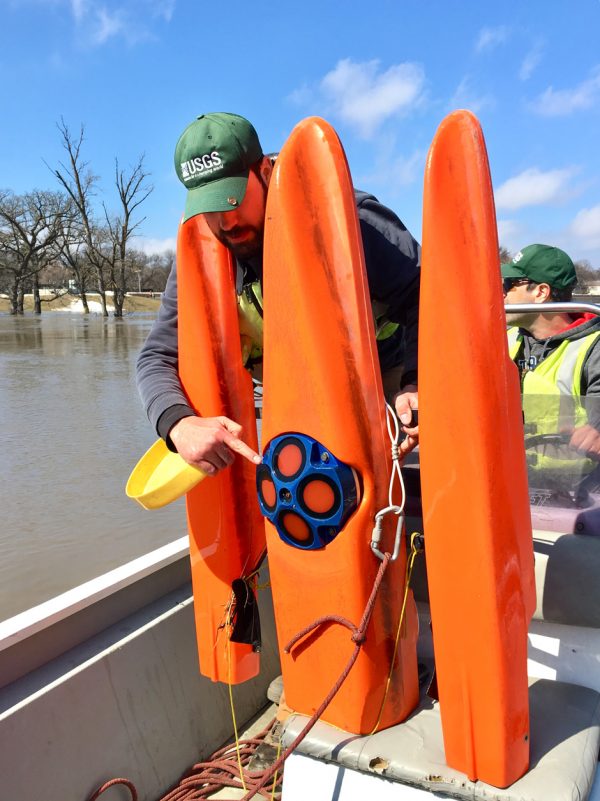
An instrument called an acoustic Doppler current profiler (ADCP) takes streamflow measurements during flooding. The ADCP is attached to a buoy that is dragged in the water either alongside a boat or by hand. USGS hydrologist Dan Thomas points to the ADCP sensor on the Red River of the North during flooding in downtown Fargo, ND. (Credit: Marisa Lubeck, USGS. Public domain.)
“There are a lot of factors in there and all the details of flood forecasting,” remarks Mr. Laveau. “A big piece of it, obviously, is how much flow is there right now? How much flow is likely to come off the landscape? How quickly will it come off the landscape?”
That is where the real-time information provided by the USGS is so critical.
“Obviously, the real-time information that’s provided during a flood, particularly on the height of the river, is very important to emergency managers, and anyone who’s involved in flood response, because they’re going to make determinations about when to take action and certain flood measures,” states Mr. Laveau. “When will we have to pull out flood walls? When will we have to sandbag? When do we have to evacuate lower-lying areas? They need information about river conditions to make informed responses.”
The USGS provides reliable, neutral information so decision-makers can act on rising river levels.
“That’s the goal of the USGS: we’re the unbiased agency providing quality data and lots of entities use our information to make decisions,” comments Mr. Laveau. “We hope that people know they can rely on it. We’re not a policymaking agency. We provide the information so others can make decisions with our information.”
Decades of data add value
The USGS has other goals for the stream gauges; they are not just used to predict flooding, and add more value over time.
“Actually, the longer a stream gauge is there on the landscape at a particular location, the more valuable it becomes,” comments Mr. Laveau. “They start to note changes in trends. If you can see climate variability in a stream gauge that’s been there a long time, you can generate better statistical information about the site.”
This speaks to some of the value of this kind of long-term field science, although it often gets overlooked.
“Imagine if you had a stream gauge on the landscape in 1930, when we were in the Dust Bowl era, and that’s all the information you had about the flow in a particular river during the 1930s,” suggests Mr. Laveau. “You would get a very different image of that river system if all you knew about was the low flow conditions that occurred in the 1930s. A stream gauge that’s been there for a hundred years provides a much better sense of the variability that can occur in that river system, and that’s something engineers need when they design new roads, new bridges. It’s something that cities and states and federal agencies need to know when they’re thinking about water supply issues.”
And while drought and flooding are obviously serious issues that get more attention, this long-term data can also help more day-to-day matters such as the growth of cities and potential water supplies.
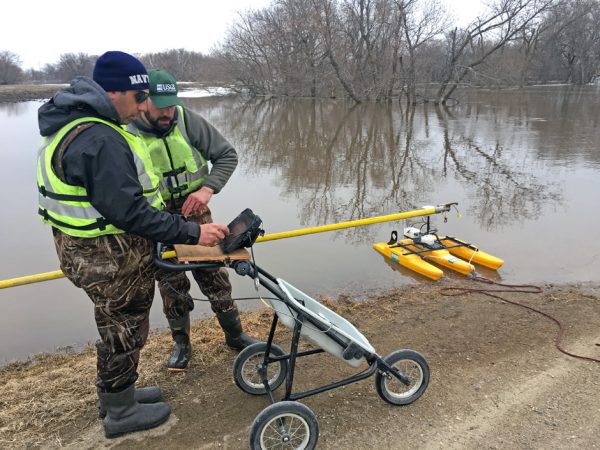
A USGS crew measures high flow during flooding on the Maple River near Mapleton, North Dakota. The yellow instrument is an acoustic Doppler current profiler, which is used to measure streamflow as it’s pulled across the water. The crew is standing on a road that had been overtaken by the river. (Credit: Marisa Lubeck, USGS. Public domain.)
“Usually the extremes of water get the most attention, whether it be flooding or drought, but those long-term stream gauges give you a better sense of what the variability is on a particular river,” adds Mr. Laveau. “We’re lucky in the Dakotas, we have a number of stream gauges that have been there over a hundred years.”
The natural variability in the landscape of the Dakotas adds more complexity to these issues, and more factors for researchers to consider.
“You have everything from the Black Hills in western South Dakota and their foothills, which have a steeper gradient and flashier runoff, to the eastern Dakotas, which are very flat, with slower runoff and much slower response to input,” details Mr. Laveau.
The flooding on the eastern Dakotas had been going on for weeks at the time of our conversation, and was likely to continue for seven to ten days before peaking—and it started a month ago. (Note: USGS Dakota Water Science Center field operations decreased from a flood response tempo around April 30, 2019).
This level of flooding is simply from normal snowmelt, or business as usual for the USGS, thanks to their long-term data.
“We just had a lot of snow and ice this year, and it takes a long time on the flat topography for that water to make its way from the landscape, fields, and tree rows into the river systems,” states Mr. Laveau. “Often, especially in flat areas, our culverts were full of snow and frozen, and so it just takes a lot of time for everything to melt and flow into the mainstem rivers.”
One Comment
Leave a Reply


Pingback: FishSens Magazine | NOAA Research Links River Flow with Changes in Chinook populations - FishSens Magazine