Monitoring the Mighty Mississippi
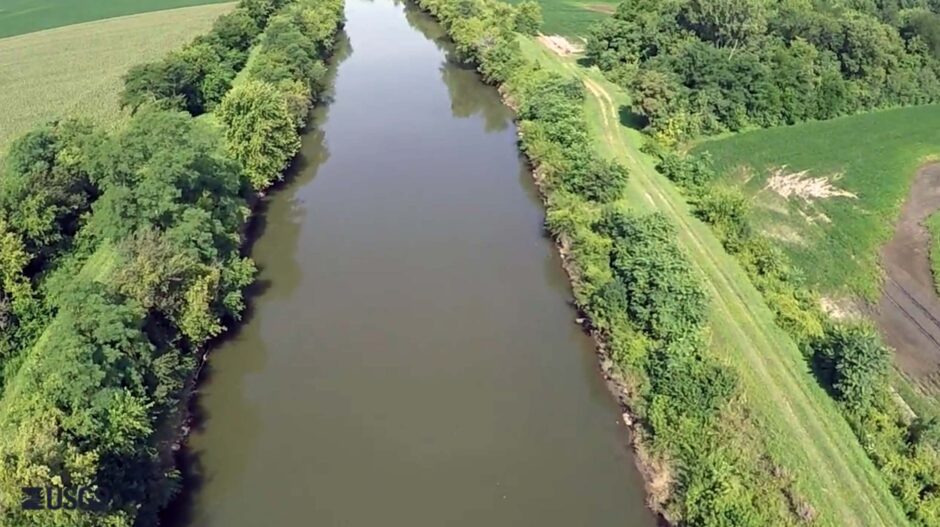
The Mississippi River from above. (Credit: USGS, https://www.youtube.com/watch?v=owKmqo3cBSY)
As of 2018, 75 percent of the main channel of the Mississippi River is monitored for water quality. This step forward is the result of an agreement between more than 30 mayors from cities close to the Mississippi River, the Mississippi River Cities and Towns Initiative. Super gauges now monitor nutrients along the river, and Scott Morlock with the US Geological Survey (USGS) spoke to EM about this project.
The whole story (map) and super gauges
To get a great overview of how the USGS’s Mississippi monitoring program works, you can scroll through their story map on the Mississippi River Basin Initiative.
“The purpose of the story map was to highlight nutrients and what USGS science is doing in the basin, and it includes a map of all the monitoring we do,” explains Morlock. “We have more than 20 nutrient super gauges in the watershed where we go ahead and monitor nutrients continuously for example. There’s a lot of information about our programs in the story map: the monitoring we do, the modeling we do, all for management use; for example, you’ve got the best management practices. We work on the science piece and the monitoring piece so you can see how effective they might be together.”
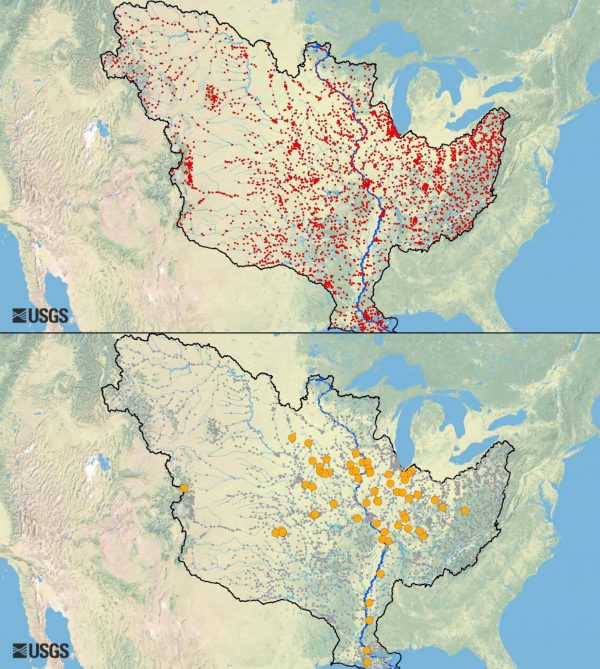
(Top) Stream gauges in the Mississippi watershed (Bottom) Super gauges in the Mississippi watershed. (Credit: USGS, https://www.youtube.com/watch?v=owKmqo3cBSY)
The interactive story map allows users to see the physical locations of the super gauges while viewing their data in real-time. “There’s also a really nice video embedded in the story map that talks about these nutrient gauges, continuous nutrient monitoring super gauges,” adds Morlock.
What’s so different about a super gauge from the perspective of USGS? Really, it’s a term of convenience based on their normal monitoring work.
“A USGS stream gauge, historically, will give you water level, stream level, and usually stream flow,” remarks Morlock. “Super gauge refers to the practice of taking one of these standard stream gauges that give you water level and stream flow and then adding water quality monitors that, say, measure sediment or give nutrients or phosphorus loads. Instead of using a phrase like ‘stream gauge with an added nutrient monitor’ we’ll say it’s a ‘nutrient super gauge.’ Typically I think when we say super gauge we’re talking about a gauge that continuously measures and transmits in real time a water quality parameter such as phosphorus, nitrate, or chlorophyll. It could measure any number of parameters.”
Beyond the mountain of data, the project is contributing to other research across the country, and the USGS is adding reliability to the mix.
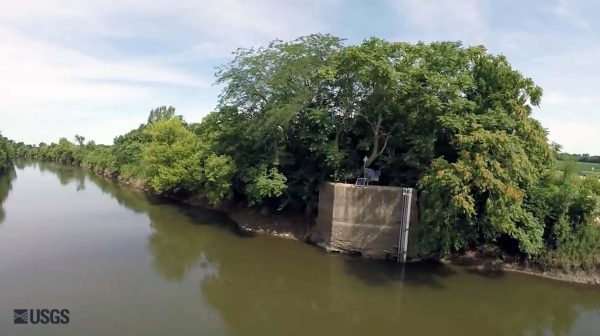
One of the USGS super gauge sites on the Mississippi. (Credit: USGS, https://www.youtube.com/watch?v=owKmqo3cBSY.)
“The Mississippi River watershed drains roughly 41 percent of the country, so it’s a huge watershed, and there are lots of different groups doing some very good science monitoring,” details Morlock. “One of the things that USGS can bring to the table is consistency. If you get information from a gauge in Minnesota or you get it from a USGS gauge in the middle of Mississippi, you’re going to have comparable data, because it was collected using the same standards.”
Applying super gauge data
Now more than ever, as nutrient reduction programs sprout up all along the Mississippi attempting to counter the growing dead zone in the Gulf, better data is critical to shaping smarter policies.
“The monitoring network is used to help compute nutrient loads to the Mississippi River every year so that scientists can look at that data and look at trends,” Morlock describes. “So I would say yes, it is definitely going to be used to look at the hypoxic zone, and to analyze the flow of nutrients coming down the river. So that’s an important piece.”
Of course, the USGS has been monitoring the Mississippi for decades—but they haven’t always been monitoring the river the way they monitor it now.
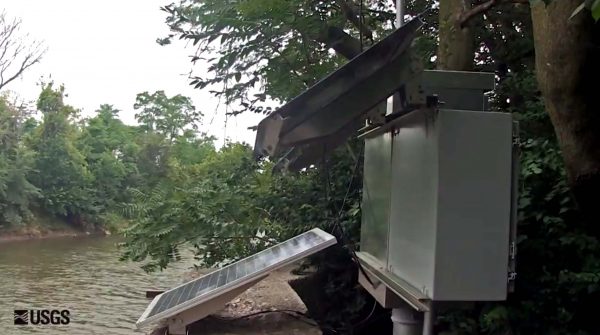
The super gauge site is powered by a solar panel. (Credit: USGS, https://www.youtube.com/watch?v=owKmqo3cBSY.)
“These gauges have varying periods of record,” comments Morlock. “Some of them are very new, and some go back quite some time. Even before we had nutrient super gauges, there were many ongoing USGS efforts to collect discrete data—for example, sampling nutrient data from a bridge for a nutrient estimate. I’m guessing we have nutrient data out there that’s decades old now.”
Although there are gaps in what we know, Morlock and the USGS team can say with certainty that we already know enough to work to protect and improve water quality.
“I can tell you we have enough data to start looking at for water quality trends,” Morlock states. “As you go downstream, as you can imagine, in some cases there is going to be quite a long lag time between actions taken upriver and seeing the effects downriver. For example, you can have legacy phosphorus that’s in the sediment of the river, so that even if you greatly reduce the phosphorous upstream, you may still have a number of years where you’re going to be delivering phosphorous to the Gulf of Mexico because it’s down in the sediment. It’s going to take time to move out of the system.”
In other words, as EM has reported in the past, there have been some great reductions in nutrients along the watershed, but the hypoxic zone is still growing. However, Morlock confirms that we should expect that for a while; that doesn’t mean the programs aren’t working.
“If you look at the story map in the section called, ‘Are things improving?’ it talks about water quality trends, and it characterizes long-term trends of nutrients in the river through the watershed,” emphasizes Morlock. “You can see trends at different stations in the whole Mississippi watershed from data that was collected between 2002 and 2012. Particularly in the upper watershed and along the main stem and some tributaries north of St. Louis, you’ll see quite a few down arrows, representing likely downtrends in nutrient runoff.”
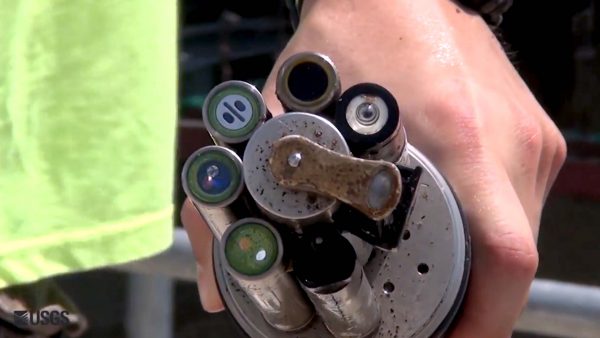
Sensors mounted on the device are inspected by hand. (Credit: USGS, https://www.youtube.com/watch?v=owKmqo3cBSY.)
This is due in large part to the diligent efforts of the many different management practices and programs in the upper Mississippi River. The Upper Mississippi River Restoration Program, for example, is an Army Corps program that the USGS supports scientifically.
“The USGS Upper Midwest Environmental Sciences Center in Lacrosse, Wisconsin works with the Army Corps of Engineers (USACE) on restoration and looking into how, say, nutrients are processed by floodplains and how they’re processed by the channel,” Morlock says. “For example, they can tell you what kind of reduction in processes or nutrients you’re getting from natural processes in river vegetation uptake. They also work with the USACE to study how to manage pool levels in those Mississippi River lakes formed by locks and dams.”
The whole program and the data it offers proves the value of long-term data collection. It may lack glamor, but it gives workable information.
“I mean you’ve got to have some longer-term data to be able to pick up trends on systems that sometimes respond over decades,” remarks Morlock.
Top image: The Mississippi River from above. (Credit: USGS, https://www.youtube.com/watch?v=owKmqo3cBSY)


0 comments