Collaborative Southeast Nexus study examines region’s air quality
While much of the world has experienced a warmer climate in recent years, the U.S. Southeast has cooled. Scientists want to know why because the answer could reveal keys to improving air quality and understanding climate change.
To study the cooling Southeast, scientists at several institutions have joined forces to conduct the Southern Atmosphere Study (SAS), the largest study on southeastern U.S. air quality since the 1990s. These include the U.S. Environmental Protection Agency, National Center for Atmospheric Research, National Science Foundation, National Oceanic and Atmospheric Administration and the Electric Power Research Institute.
Five air quality studies fall under the SAS umbrella. One of them, called Southeast Nexus, is looking at the source of aerosols and hydrocarbons in the area and their contributions to haziness and poor air quality. Natural hydrocarbon emissions from forests in the Southeast are the highest in the country and scientists expect the results will yield insights important to understanding the atmosphere in the rest of the nation.
“Trees emit a lot of hydrocarbons in the atmosphere. It’s what you smell when you walk through a forest,” said Joost de Gouw, a research scientist with NOAA and the Cooperative Institute for Research in Environmental Sciences at University of Colorado Boulder. “These are much larger than the man-made emissions.”
Hydrocarbon emissions, manmade or not, are important because they react with nitrogen oxide in polluted air to form ozone and other heat-trapping particles in the atmosphere. In the Southeast however, the same types of emissions and aerosols could play a role in the area’s cooler climate. That is precisely the hypothesis de Gouw and others are testing, but analysis can’t begin until all the data is collected.
")
Instruments onboard the WP-3D aircraft (Credit: David Oonk/CIRES)(Credit: David Oonk/CIRES)
De Gouw, who has served on multiple NOAA air quality research missions, is highly familiar with the plane and instruments used for data collection. And the long flights.
“It’s seven hours. We fly down low for five of those hours. The air is very turbulent down there, very bumpy,” said de Gouw. “It’s a physically demanding thing to do.”
One reason they fly low is to collect discrete air samples, just one of the many samples they collect. The NOAA WP-3D is a prime research airplane, equipped to collect roughly 20 to 25 different kinds of measurements. De Gouw says there are many mass spectrometers aboard and instruments to take optical measurements like light absorption and scattering rates. Probes stick out of the aircraft and pump air in to be analyzed.
Five scientists aboard flights look after the instruments, though many operate autonomously without a human manager. A scientist in the back of the plane watches as the data comes in and may change the flight plan in an instant to inspect a scientifically interesting region more closely.
")
(Credit: David Oonk/CIRES)
Those in-air measurements combine with others taken on the ground to give a more complete profile of air in the Southeast. The Electric Power Research Institute facilitates ground measurements because it has been tracking air quality for many years and already has sites running at or near power plants, de Gouw said.
Some of the instruments at the ground sites are gas spectrometers and other chromatography instruments that separate air samples to measure the concentrations of hydrocarbons they contain. Anywhere from 60 to 100 hydrocarbons can be measured from sensors on the ground.
“The ground sites can carry a lot more instruments and record around the clock. It’s very detailed data,” said de Gouw. “By combining the two (data from the air and ground), it gives us a very detailed picture. It’s a very powerful combination.”
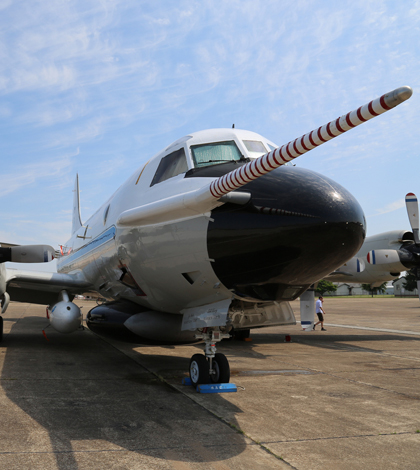
Top image: Airborne measurements for the Southern Atmosphere Study are collect by NOAA’s WP-3D aircraft (Credit: David Oonk/CIRES)


0 comments