Pyunicorn Software Reveals Climatic Tipping Points

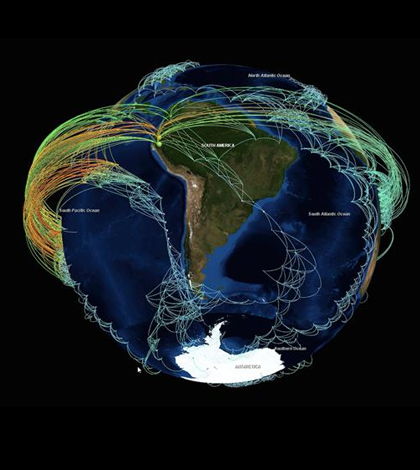
Climate network visualization revealing the backbone structure of strong statistical interrelations between surface air temperature time series all over the globe. (Credit: T. Nocke / PIK Potsdam and C. Tominski / Uni Rostock)
The more complex data are, the harder it is to identify trends. Especially in the case of large, complex systems, it can be difficult to detect a trend that is somewhere between linear and pure chance. Climate systems, for example, are complicated to analyze, as are nonlinear weather patterns.
However, a new programming language called pyunicorn has been created to reveal extremely complex information such as climatic tipping points, according to a release from the American Institute of Physics. Pyunicorn synthesizes two concepts: complex network theory and nonlinear time-series analysis.
A complex network can be biological, social or technological in nature, and it typically has patterns that are not quite regular but also not purely random. Nonlinear time series look at how patterns unfold through time, even complex ones that appear to do so chaotically.
Pyunicorn is written in Python, a popular open-source code. It is available for free to the scientific community on GitHub.
Top image: Climate network visualization revealing the backbone structure of strong statistical interrelations between surface air temperature time series all over the globe. (Credit: T. Nocke / PIK Potsdam and C. Tominski / Uni Rostock)


0 comments