Rhode Island Streams Surveyed With Handheld Water Quality Meters, Nets
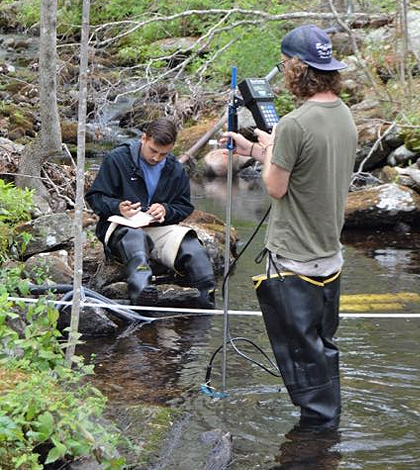
Matt Swartz, left, and Tyler Torelli collect data from Cork Brook. (Credit: University of Rhode Island)
A sampling project led by University of Rhode Island researchers is helping to reveal the dynamics of aquatic health in three streams while supporting undergraduate education and local drinking water. The effort, relying on dip nets and handheld water quality meters, also gave students the chance to connect with Rhode Island’s hydrology.
For Britta Anderson, graduate student in the department of geosciences at the university, the project offered something else.
“Last summer was my first summer, so I had experience and the knowledge from that,” said Anderson, who oversaw undergraduate students who assisted during this year’s leg of the project. “I was able to continue this summer as more of a mentor.”
Anderson, who did her undergraduate studies at the University of Minnesota, says that the sampling effort has also helped her to learn more about Rhode Island. It gave her the chance to jump in and get involved as soon as she hit the ground.
The project focuses on three streams. There is Cork Brook, near Scituate, R.I., which is the least affected by human development than the other two. These include Bailey’s Brook and the Maidford River, both of which are nearer to Middletown.
Bailey’s Brook is around 55 percent urban and 30 percent agricultural, Anderson says. The Maidford River is nearly the opposite, at 30 percent urban and 40 percent agricultural.

Britta Anderson, far right, with Jennifer Kane and Kristin McDermott of Salve Regina University sample for macroinvertebrates in Cork Brook. (Credit: Britta Anderson / University of Rhode Island)
“The goal was to monitor two streams and compare what we’re finding in those urban areas to Cork Brook,” said Anderson.
To get there, she and others sampled up and down the streams using a YSI handheld water quality meter recording temperature, conductivity and pH at multiple sites. They used test kits to sample for phosphorus and nitrates every week. And dip nets helped them to sample populations of macroinvertebrates, markers of pollution.
“We’d go out into the stream and sample ripples and pools. We’d kick the substrate upstream a few times while sampling them downstream,” said Anderson. “We chose to do 100 organisms in our samples. Other methods count what’s in the whole bucket, but we chose to go with 100. At some spots, it was easy to go with that. At others, the streambed was dry or it had just rained and washed everything out.”
Investigators sorted the macroinvertebrates based on their scientific orders in an effort to show relationships with the chemical data collected. They used the EPT index (sum of Ephemeroptera, Plecoptera and Trichoptera divided by the total number of midges) to say which orders dominated in certain streams. By gauging if more or less pollutant-tolerant species won out, researchers had a clear marker of water quality.
Most of the macroinvertebrates that were collected turned out to be mosquitoes, midges and blackflies. But there were a few outliers in that effort.

Water Boatman (order Hemiptera) collected during sampling. (Credit: Britta Anderson / University of Rhode Island)
“At one site on Bailey’s Brook, it had a very high EPT score compared to sites upstream and downstream and it was in the very middle of the stream right by a parking lot,” said Anderson. “Everything else was pretty predictable.”
Scores throughout the streams are being compared to surrounding vegetation to gauge the relationship between that and macroinvertebrate populations. Doing that is helping researchers to make more sense of the data.
Full findings on the streams’ health aren’t yet available, as investigators are continuing to sift through their datasets. There is hope that they can reveal some trends. The biggest difference that Anderson saw between the streams from this year and last were most likely due to drought.
“We have data for 2014, 2015 and 2016. We’re looking for correlations but also how the information varies over the three years that we have data for,” said Anderson. “If there are changes, what are they coming from?”
Funding for the work was provided by the National Science Foundation’s EPSCoR Track-2 program through the North East Water Resources Network (NEWRnet). The network is a collaboration between Massachusetts, Rhode Island and Vermont. Researchers from Salve Regina University also assisted in the effort.
Top image: Matt Swartz, left, and Tyler Torelli collect data from Cork Brook. (Credit: University of Rhode Island)


0 comments