Root River Field to Stream Partnership Wields Technology and Respect
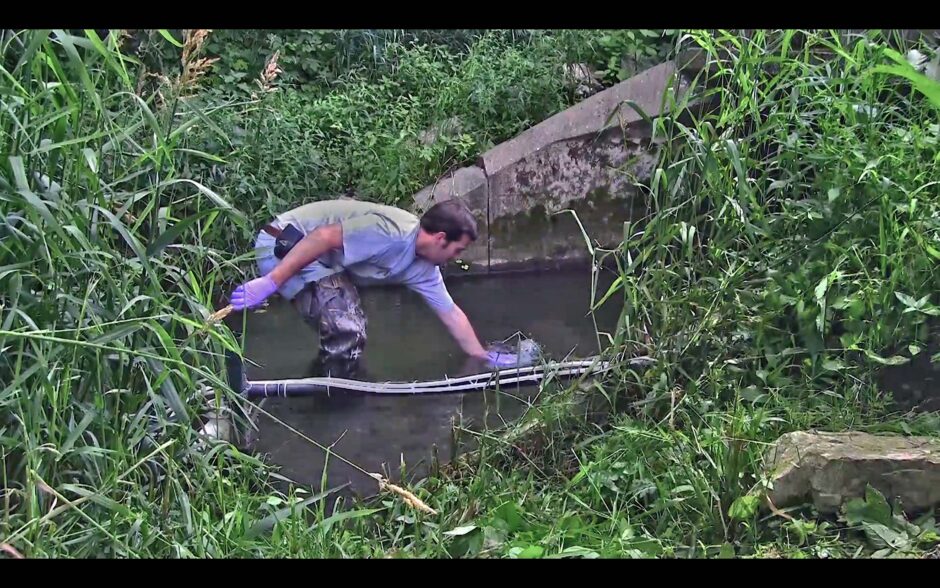
Team member collects samples for testing. (Credits: (both) screenshot, MDA video)
Minnesota’s Root River Field Stream Partnership is taking old-school concepts like stewardship and family farming values and teaming them up with the latest agricultural technologies to help local producers get ready for a more sustainable future. The project proves how much states and localities can achieve if they target high-risk runoff practices in strategic locations within local watersheds and replace them with more sustainable practices—a granular, focused approach.
Margaret Wagner, the supervisor of the Minnesota Department of Agriculture’s Clean Water Technical Assistance Unit, and Kevin Kuehner, a soil scientist with the MDA, corresponded with EM about the program and spoke for the team implementing it.
“The Root River Field to Stream Partnership (RRFSP) is a unique southeastern Minnesota water monitoring project,” explains the team. “This project uses both edge-of-field and in-stream monitoring stations to characterize water quality in three regions of study within the Root River watershed.”
Monitoring from root to river
The program supports both three in-stream stations and groundwater spring monitoring.
“These sites are equipped with year-round automated sampling equipment to capture runoff from the entire year including early season snow melt/rainfall events during frozen soil conditions,” details the team. “Grab samples are collected during low flow conditions and after storm events. Both edge-of-field and in-stream monitoring includes analysis of total runoff volume, total suspended solids, total phosphorus, dissolved phosphate, total nitrogen, ammonia nitrogen, total Kjeldahl nitrogen, nitrite-nitrogen, and chloride. Over 40 organic pesticides and degradates are analyzed at the in-stream stations.”
The Minnesota Department of Agriculture (MDA) provides leadership for the project and conducts much of the analysis, but the monitoring is very much a group effort.
“The MDA leads this project by providing technical and administrative oversight and funding provided by Minnesota’s Clean Water Fund,” the team describes. “The MDA is responsible for project design, site maintenance, data management, analysis, interpretation, and quality control. The MDA also prepares reports and gives presentations to a variety of stakeholders. Local partners are responsible for collecting water samples and submitting them to the MDA lab. Local partners also help maintain and troubleshoot monitoring equipment and manage contracts with other local partners.”

A team works on a monitoring station. (Credit: screenshot, MDA video)
Data collected from the watersheds is being saved for application to problem solving throughout the region in the future. According to the team, the Root River FSP data is being used to answer several questions, including how far ranging nutrient and sediment losses from agricultural fields are, how effective existing and newer agricultural conservation practices are, and which long-term relationships and trends connecting water quality and specific farming practices exist.
“Edge-of-field data are being used to calibrate water quality models such as SWAT, HSPF and PTMaPP,” remark the team members. “Seven years of baseline water monitoring data has been collected. The project recently transitioned into Phase II where additional, targeted conservation practices are implemented and monitoring continues to evaluate the effectiveness of those practices.”
The monitoring locations were chosen deliberately, both with the outstanding questions and the needs of the participants in mind.
“Edge-of-field and in-stream monitoring is occurring in three sub-watersheds within the larger Root River watershed,” state the team members. “Monitoring locations were selected strategically to represent the diversity of landscapes including the glacial till uplands, karst and bluff land regions. Data from these three areas can help us gain a more thorough understanding of how agricultural practices affect the health of local rivers and streams.”
Bringing new farms into the fold
When a new farm joins the program, there is a protocol for assessing the water quality next to the farm if it’s streamside and the participant’s existing farming practices. However, this part of the process is still being optimized by participants.
“A core group of four farmers and five crop advisers have been part of the Root River FSP since it started in 2009,” explain the team members. “They host edge-of-field monitoring stations and are allowing us to evaluate nutrient and sediment losses on their farms. This is an incredible opportunity to get ‘real world’ data and requires a lot of trust on the part of the farmers. They host field days and are learning along with us from the data collected on their farms. They have been advocates and strong supporters of this project. All partners serve on an advisory team which meets annually.”

Edge of field monitoring system in the works. (Credit: screenshot, MDA video)
The project spokespeople described two key components of the RRFS partnership which are unique.
“First, this project has a ‘nested’ monitoring design which includes edge-of-field sites nested within sub-watersheds,” details the team. “Edge-of-field sites provide information about the amount of soil and nutrients moving off a given field. Each site captures water from an area between 16 and 95 acres. In-stream monitoring sites are located at the outlet of three small watersheds.”
Each site captures water from an area of 2,700 – 4,800 acres. Data from these two types of monitoring stations allows the MDA to evaluate how practices within a field influence water quality at the watershed scale.
“The second feature is our step-by-step conservation delivery process that included on-farm walkovers,” the team members describe. “Prior to walking the fields, our team used digital terrain analysis tools to inventory existing practices.”
The MDA next use a computer modeling approach to determine which areas of the landscape in question are most vulnerable. A dedicated conservation technician works with farmers to survey or “walk over” every field in the study area.
“This information was used to develop individual action plans that identified high and low priority fixes and estimated costs,” remarks the team. “This process combines the right technical skills with the right mode of delivery—in other words, it’s important to invest in a local person that is a peer among farmers and has good technical and communication skills.”
Once the farmers who participate sign on to the RRFSP, they commit and take charge of their operations to make the program work.
“Active and continuous participation by local farmers has been a valuable aspect of this project,” adds the team. “There are 48 farmers across the three sub-watersheds in the study area. They host edge-of-field monitoring stations and are evaluating nutrient and sediment losses on their farms. They host field days, help to review reports and give feedback on outreach materials. They have been advocates and strong supporters of this project.”
The progress is in the details
The RRFSP uses edge-of-field, springshed, shallow cropland groundwater, and in-stream monitoring to characterize water quality in the three sub-watersheds. In 2009, they installed nine monitoring stations: three in-stream and four edge-of-field stations, along with one subsurface drainage and one intermittent stream station. In 2017, the team installed a groundwater spring monitoring station.
These sites are equipped with year-round automated sampling equipment using flow increment composite sampling to capture runoff from the entire year including early season snow melt/rainfall events during frozen soil conditions. This time period can be a significant source of dissolved ortho- phosphorus and runoff volume. Both edge-of-field and in-stream monitoring includes analysis of total runoff volume, total suspended solids, total phosphorus, dissolved phosphate, total nitrogen, ammonia nitrogen, total Kjeldahl nitrogen, nitrite-nitrogen, and chloride.
At the in-stream stations, analysis of over 40 organic pesticides and degradates takes place. Other measurements include air temperature, humidity, rainfall, soil temperature and moisture (at 6” and 24”), wind speed, and solar radiation (used to model evapotranspiration and ultimately a basic water balance) at selected stations. The team also monitors for supplemental nitrate and collects soil water nitrate samples. Differences in losses between edge-of-field and in-stream sites tells team members how and when sediment and nutrients are assimilated or stored, and helps them to identify the origins of nitrates. Along these lines, the team has also conducted sediment fingerprinting and legacy/bio-available phosphorus studies.
On average, 1,428 lb/ac of sediment was measured in field runoff—although at one site with observed ephemeral gully erosion, nearly 9,000 lb/ac was measured during a wet year. A sustainable level of soil loss is somewhere between 500 and 1,000 lb/ac per year. Average Total P loss is 1.6 lb/ac, with about 80 percent attached to sediment. Between 70 and 90 percent of the annual phosphorus and sediment loss occurs in May and June when fields are prepared or planted but not at full canopy.

Runoff flows off fields directed by flume. (Credit: screenshot, MDA video)
Sediment fingerprinting results indicate that 60 to 80 percent of the sediment is derived from field sources in the study watershed. In-stream sediment and phosphorus loss rates are about 50 to 60 percent of that measured at the field scale. Trapping of sediment along fence lines, road ditches, in floodplains and within existing conservation practices are likely reasons for this reduction.
The MDA and project partners work hard with multiple tools to carefully determine which fields are higher risk for runoff.
“This process uses a combination of tools including digital terrain analysis tools such as the stream power index, air photo interpretation of active visible erosion areas and high runoff risk fields identified using the ag conservation planning framework (ACPF),” remark the team members. “One of the outputs of the ACPF is a high runoff risk field summary which is based on average field slope and distance to stream.”
They take just as much care determining which measures are most likely to produce the greatest improvements in the water—and they have created a database of information to assist in this aim, one that’s constantly growing.
“The MDA developed a detailed conservation planning database of existing practices, evaluated the quality of those practices, and identified areas with additional conservation needs,” the team describes. “The Agricultural Conservation Planning Framework (ACPF) developed by the Agriculture Research Service (ARS) along with other digital terrain analysis tools, such as the Stream Power Index (SPI), were used to identify critical source areas and fields. These data were verified in the field. The probability of erosion occurring within fields at non-best management practice (BMP) sites were up to six times higher than for fields with BMPs.”
The MDA and their partners also found through their seven years of edge-of-field monitoring that fields with ephemeral gully erosion lose, on average, over three times more soil and attached nutrients when compared to similar fields without this type of erosion. Therefore, based on this finding, the project targeted concentrated flow areas that are likely to develop ephemeral gully erosion.
Making the most of existing stewardship
The RRSFP is fostering a sense of stewardship in the participants—but that stewardship didn’t start with the program.
“Project farmers have always had a sense of stewardship and have used a variety of conservation practices prior to the start of this project,” clarifies the team. “Edge-of- field monitoring, however, has increased the awareness and action to focus on critical source areas within the field and time periods where runoff risk is the highest.”
In other words, the program has simply given participant farmers, who already care deeply about the land and their livelihood, more effective tools for protecting both. So far, the program appears to be working, even though formal detection of statistically significant improvements to water quality at the small watershed scale take years to establish.
Still, the team has established with data that sustainable practices work, and they’ve managed to implement many of those practices. For example, they’ve installed 90 grass waterways across more than 65,000 linear feet in high priority areas, and 11 new sediment and water control basins at the edge of targeted field locations. They’ve rehabilitated a sediment storage and flood retention structure from the 1950s that treats almost 50 percent of the study watershed. They’ve advised project farmers to plant almost 200 acres of cover crops and 74 acres of pollinator habitat in the watersheds. They’ve also helped participants improve feedlots and wastewater systems.
The monitoring will continue; now that more sustainable practices have begun to be implemented, the data may start looking significantly different. Over time, the participants are banking on a change taking hold at the root level and growing outward from there.


0 comments