
Inexpensive sensors ushers in nationwide boom in stream temperature monitoring
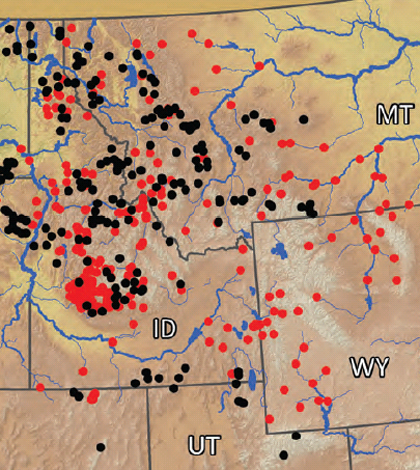
Each dot represents one of over 500 monitoring sites in the NoRRTN stream temperature network (Credit: U.S. Forest Service)
The advent of inexpensive, small and accurate water temperature sensors has led to an explosion in stream monitoring networks across the United States, according to a federal scientist.
The networks have generated a wealth of useful information, but much of it is isolated in local datasets. If harnessed as a whole, the data could generate powerful tools to help scientists, conservationists and land managers prepare for climate change, says Dan Isaak, fisheries research scientist at the U.S. Forest Service’s Boise Aquatic Sciences Laboratory.
“It comes together into something pretty powerful once that’s pulled together and people can start to use it,” he said in an interview.
Isaak recently gave a talk called “Rapid Emergence of Massive Temperature Monitoring Networks in Streams & Rivers Across North America” at the annual meeting of the American Geophysical Union in December.
The rise in temperature networks is attributable to cheap digital sensors that can be had for $150, and sometimes much less, Isaak said. As a result of improvements in battery life and installation methods, monitoring programs in the Northwest that once used sensors for just a few months during the summer, low-flow season now have stations collecting data year-round. The Northern Rockies River Temperature Network, for example, boasts 563 sites across a handful of Northwestern states.
")
Isaak helped develop a protocol for installing sensors on boulders with underwater epoxy to keep sensors out year-round. Click the image for the protocol. (Credit: U.S. Forest Service)
One problem with the expansion of stream temperature monitoring is that is hasn’t been very well coordinated, and lots of data is spread out among hundreds and hundreds of people, Isaak said. That has prompted efforts across the country to gather regional data into centralized, open-access databases that allows local datasets to be applied to larger purposes. The U.S. Forest Service hosts one such project: the NorWeST database, which holds 45 million hourly temperature measurements from 15,000 sites across five states.
One use of the aggregating is to inform models that fill in gaps and estimate temperatures for unmonitored sites. With measured and estimated data, scientists can create high-resolution temperature maps for whole watersheds or regions, which are useful tool for understanding how a species is distributed and where it might be most vulnerable. The maps can also illustrate how temperatures might change under various climate scenarios.
“As fast as we can create stream temperature climate scenarios, the environmental community picks those scenarios up and uses them,” Isaak said. “They’re accurate enough that it really empowers them with good local information that they can make better decisions about what they’re doing and where and why they’re doing it.”
")
A high-resolution stream temperature map based on data from Northwestern states. (Credit: U.S. Forest Service)
But the most exciting aspect about the advancements in temperature sensing isn’t bringing data together, it’s bringing people together, Isaak said. The sensors are so easy to use that agencies can hand them off to school children, Trout Unlimited chapters or anyone else interested in questions about temperature and how it affects fish and aquatic organisms.
“They can be engaged in the process and understand better how temperature dynamics occur and think about climate change,” Isaak said. “It helps us build stronger social networks to link people together that care about some of these issues.”
Top image: Each dot represents one of more than 500 monitoring sites in the NoRRTN stream temperature network (Credit: U.S. Forest Service)


0 comments