
Study: Less is more when monitoring Chesapeake Bay dead zone
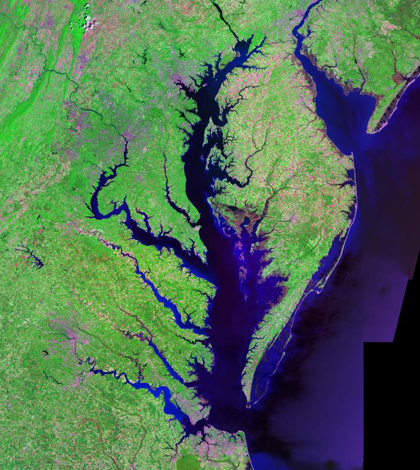
An aerial view of Chesapeake and Delaware bays from the Landsat satellite (Credit: USGS, vis Wikimedia Commons)
Covering nearly 4,500 square miles of the eastern United States, the Chesapeake Bay is a hotspot for the seafood industry. More than 300 species of fish and numerous other aquatic lifeforms make their home in the Bay. But each summer, those species lose valuable habitat space to the formation of one of the country’s largest hypoxic zones.
Since 1984, the U.S. EPA’s Chesapeake Bay Program has monitored the magnitude and duration of the Bay’s dead zone using permanent monitoring stations. Scientists in the program take readings from 30 to 60 monitoring stations once each month — and every two weeks in the summer — to estimate the Bay’s hypoxic volume. A new study by researchers at the Virginia Institute of Marine Science, however, suggests that when it comes to measuring the dead zone, less is more.
“Using fewer stations sampled more quickly (10 stations sampled over two days) [produces] more accurate estimates of hypoxic volume compared to sampling more stations over a longer period of time,” said VIMS professor Marjy Friedrichs in an email. “Ultimately we found that significant errors are introduced by the fact that it takes nearly two weeks to, sample all 30-60 stations–by the time the last stations are sampled, the system has changed significantly.”
Ideally, the Chesapeake Bay Program should provide a “snapshot” of the Bay’s hypoxic system. The traditional monitoring method, Friedrichs said, largely fails to do this.
The VIMS study also found that out of all the variables used to measure Bay hypoxia — including area, thickness, duration and peak volume — cumulative hypoxic volume is the most useful. Cumulative hypoxic volume is less sensitive to changes in oxygen level than other metrics, and factors in the effects of climate change, Friedrichs said.
Each monitoring station creates a hydrographic vertical profile including “measurements of water temperature, salinity, and dissolved oxygen,” according to the “Guide to Using Chesapeake Bay Program Water Quality Monitoring Data.” The stations also collect water samples for laboratory analysis of nutrients, pigments and suspended solids.
Maximizing the efficiency of the Chesapeake Bay Program’s efforts could save countless aquatic lifeforms, and in turn, ensure the sustainability of human recreation and tourism in the Bay.

Dissolved oxygen values for a late August monitoring cruise in 2009 (Credit: NOAA)
Normal aquatic levels of dissolved oxygen measure at 7 to 8 milligrams per liter. Fish will actively avoid zones containing 3 to 4 milligrams of dissolved oxygen per liter, and not even shrimp or crabs can be found in zones at 1.5 milligrams or below. Water with less than 2 milligrams of dissolved oxygen per liter is considered to be hypoxic.
In the summer, the Bay’s surface can reach high temperatures, while its deeper portions drastically lose dissolved oxygen. The inability of certain species — such as striped bass — to inhabit these areas leads to a habitat squeeze, increasing rates of disease and mortality, and diminishing habitat capacity.
Hypoxic zones form when nutrients from fertilizer and other other human products enter waterways, leading to mass algae blooms. The algae eventually die and sink to the bottom, where they are consumed by bacteria. In the process, the bacteria also consume dissolved oxygen in the water, creating a dead zone.
To counter this, Bay restoration efforts focus on the reduction of nutrient inputs, particularly through improved farming techniques and sewage system renovations.
The Chesapeake Bay Program has established a set of Total Maximum Daily Loads. These “pollution diets” aim to improve the water quality of the Bay and its connecting waterways by setting limits on nitrogen, phosphorus and sediment pollution.
The Chesapeake Bay TMDL is the largest cleanup plan ever designed by the EPA, according to the Chesapeake Bay Program website. With it, and the aid of new methods established in the VIMS study, the Chesapeake Bay Program can more effectively manage the Bay’s health under the threat of climate change and other environmental factors.
Top image: An aerial view of Chesapeake Bay from the Landsat satellite (Credit: USGS, vis Wikimedia Commons)


0 comments