The National Lakes Assessment In Focus

Lake Tahoe's water is known for its clarity, with Tahoe Regional Planning Agency reporting an average annual clarity level for 2014 of 77.8 feet. (Credit: inkknife_2000 (7.5 million views +) [CC BY-SA 2.0 (https://creativecommons.org/licenses/by-sa/2.0)], via Wikimedia Commons)
Recently, EM reported on research from a team led by Dr. Dina Leech that shows America’s lakes are getting murkier. That study made use of the National Lakes Assessment (NLA), a unique collaboration between states, the US Environmental Protection Agency (EPA), and tribal governments. NLA is generating a tremendous amount of limnological data and making it publicly available; Tricia Lynn of the EPA’s Office of Public Affairs corresponded with EM about the NLA.
“The National Lakes Assessment is designed to assess the status of and changes in select water quality characteristics of lakes in the continental US,” explains Lynn. “The NLA uses a statistically representative site selection process and an intense single-time sampling approach on 1,000 lakes across the country to provide a snapshot of select water quality characteristics in the continental US. Because the project uses standardized field and lab methods, we can compare results from different parts of the country and between years.”
Crews conduct NLA field sampling every five years from June through September. During these assessment periods, crews collect data at approximately 1,000 lakes, including natural lakes, ponds and reservoirs throughout the continental US. So far, there have been three of these events (2007, 2012 and 2017) and each has been a true team effort.
“States and tribes participate in these surveys through the Monitoring Initiative portion of their Clean Water Action Section 106 grants,” Lynn describes. “They are integral partners working to plan NLA, conducting field and some lab work, and providing support from beginning to the end of each cycle.”
The EPA supports each site by leading implementation of the surveys; developing quality assurance, field and lab manuals; and providing logistical support such as field crew training and standardized supply kits for sampling. The EPA also manages incoming data and conducts the core data analysis. Coinciding with the publication of the NLA 2012 report, the EPA released a new interactive data dashboard that allows users to explore population-scale results from the NLA and compare conditions nationally, across ecoregions, and EPA regions.
A unique design
According to Lynn, the EPA created the NLA’s probability-based design for the project, incorporating survey design techniques as part of a statistical sampling approach. The technique allows a representative sample of a relatively small group of individuals to be chosen from a large group of possibilities, using a stratified random design that controls for spatial distribution, lake size, and representative geographical character and variation.
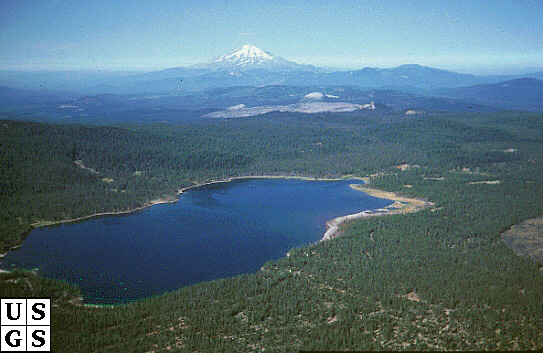
Aerial view of Medicine Lake, California from the northeast. (Credit: Photo by Julie Donnelly-Nolan [Public domain], via Wikimedia Commons)
This is a change from 2007, during which the team assessed only those lakes greater than 10 acres (4 hectares) in size.
“Additionally, to offset the potentially competing objectives of assessing condition and identifying trends, the design for every year includes about 40 percent resample lakes,” clarifies Lynn. “These are included to improve change/trend analyses.”
The NLA includes a core set of indicators monitored for each survey, and the teams also add research or other supplemental indicators in some situations. Lynn details:
“The indicators collected in 2017 were: water chemistry (NH4, NO3), major anions and cations, alkalinity (ANC), DOC, TSS, silica, conductivity , true color, nutrients, Chlorophyll-a; vertical profile measurements (DO, temperature, pH); Secchi Disk transparency; benthic macroinvertebrate assemblage; zooplankton assemblage; phytoplankton (cyanobacteria); physical habitat characterization; algal toxins (microcystins and cylindrospermopsin); bacteria (E. coli); Atrazine pesticide screen; lake area, basin morphometry, and characteristics of watershed; and several research indicators including sediment contaminants, TOC, and grain size; dissolved gases (3 types); and fish eDNA.”
Reference lakes, changing times
To assess conditions, the NLA team compares metrics to benchmarks developed from the range of values observed in a set of “reference lakes.”
“A reference lake in the NLA is a lake, either natural or man-made, with attributes (such as water quality) that come as close as practical to those expected in a natural state, i.e., a least disturbed lake,” states Lynn. “To reflect the natural variability of the U.S., the definition of what is least disturbed varies by ecological region or ecoregion. For this reason, reference conditions are established regionally and screening criteria may differ among these regions.”

Tenaya Lake, Tioga Pass, Yosemite National Park. (Credit: Brocken Inaglory [CC BY-SA 3.0 (https://creativecommons.org/licenses/by-sa/3.0) or GFDL (http://www.gnu.org/copyleft/fdl.html)], from Wikimedia Commons)
The EPA (and others, such as this separate analysis from Dr. Dina Leech) are now reporting on observations of conditions and changes from 2007 to 2012. For most indicators, no change occurred, but changes in total phosphorus, two algal toxin indicators, and a physical habitat indicator are exceptions.
“While EPA did not observe changes in the condition categories for the nutrient phosphorus, Leech et al. 2018 found an 18.2 percent decline in the percentage of oligotrophic lakes (very clear lakes with less than 10 μg/L of total phosphorus) and an overall increase in the median concentration of phosphorus across all lakes,” comments Lynn. “The NLA 2012 Assessment Report observed a change within algal toxin measures. An analysis of cyanobacteria cell density, a measure of the density of cells that could produce cyanotoxins, showed a statistically significant increase (+8.3%) in the percentage of lakes in the most disturbed category between 2007 and 2012. The NLA identified a significant increase in the detection of microcystin among lakes in 2012 (+9.5%). However, concentrations of this algal toxin remained low and rarely exceeded WHO recreational levels of concern (<1% of the population) in both assessments.”
The NLA 2012 Assessment Report also found fewer lakes in the least disturbed category and more lakes in the moderately disturbed category for the habitat complexity indicator—which has to do with lakeshore habitat and buffering qualities.
The ability to “see” these trends on a national scale is impressive. This highlights the NLA as a truly unique resource, which is filling a gap in state and local monitoring of American lakes.
“Importantly, NLA serves as a valuable complement to state and tribal programs,” adds Lynn. “For example, Vermont used information from the NLA to look at how lakeshore habitat quality in Vermont differed from lakes nationally and regionally eventually passing new lake shoreland protection legislation. Minnesota leveraged the NLA to expand sampling to achieve state-scale assessments and to add additional parameters such as pharmaceuticals. Ohio leveraged the fieldwork and subsequent analysis from NLA 2007 as momentum to expand algal toxin monitoring in lakes within the state. The strength of the NLA, including the national scope, randomized design, standardized field and lab methods, and co-located data continue to allow EPA, states and other researchers to utilize the resulting data to address a variety of questions.”
Top image: Lake Tahoe’s water is known for its clarity, with Tahoe Regional Planning Agency reporting an average annual clarity level for 2014 of 77.8 feet. (Credit: inkknife_2000 (7.5 million views +) [CC BY-SA 2.0 (https://creativecommons.org/licenses/by-sa/2.0)], via Wikimedia Commons).


0 comments