Understanding Stream Dynamics By Supplementing Stream Gages
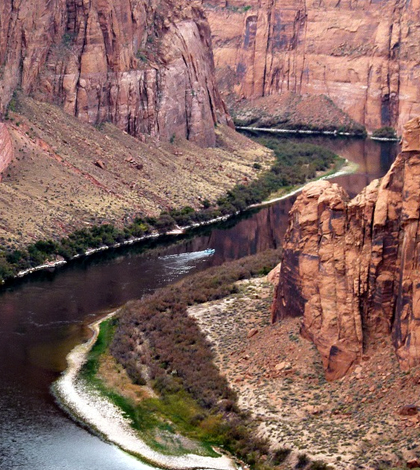
Colorado River. (Credit: Public Domain)
The U.S. Geological Survey (USGS) has many stream gages deployed throughout the state of Arizona. But during flash floods, scientists with the agency sometimes like to have more than the data those gages provide.
In those cases, hydrologists with the USGS commonly go out and install extra water level loggers to capture changing stream dynamics. Wildfires, like the Sunflower Fire of 2012 near the Sycamore Creek area, can cause abrupt alterations to stream flows that scientists are eager to capture.
But there are a few other reasons that USGS scientists deploy the additional sensors.
“We do this for many reasons. One, redundancy, losing a sensor in a flash flood won’t cause any gap in stream flow record,” said Brandon T. Forbes, hydrologist with the USGS. “Two, we can use the stage data over multiple cross sections in the channel reach to calibrate both 1-D (dimensional) and 2-D flow models. This allows us to estimate additional parameters, for example Manning’s n at different flow depths. Three, we can refine our rating curves at the the gaging station to improve the accuracy of our streamflow data.”
Forbes personally went out and studied streams affected by the Sunflower Fire. Some of those efforts are detailed in a USGS video. In it, experts lay out the causes of the fire and their efforts to document some of its impacts on streams.
This included their use of the continuous slope-area method for capturing flow events. To carry out the method on Sycamore Creek, Forbes and others deployed multiple slope-area sensors at cross sections of the creek. At the heart of each was a level logger. A non-contact radar water-level sensor was also used at one area due to extensive damage caused by fire.

Hydrologists work to install continuous slope-area sensors on Sycamore Creek. (Credit: U.S. Geological Survey)
“These CSAs (continuous slope-area sensors) can withstand and measure the more extreme runoff events commonly seen after a watershed has been burned,” an agency spokesperson says in the video. “These data can also be used to measure the rate of recovery for a burned area that has been affected by wildfire.”
In another example of this approach, Forbes and colleagues were able to track the impacts of pulses released from a dam in the Lower Colorado River Delta. Since they knew when the flooding would come, they were able to install the same sensors days before high flows started.
That effort is also detailed in a video from the U.S. Geological Survey and features first-person footage from a headcam worn by one of the researchers.
“In this unique event in the pulse flow, in the Colorado River, we were able to put these sensors in and we knew when the flood was coming and how big it was going to be so we could prepare before the flood and collect as much data as possible during the event,” said Forbes, in the video.
For that experiment, USGS experts with the Yuma, Arizona field office were able to chip in measurements with acoustic doppler current profilers (ADCPs). Those provided very accurate discharge measurements that could be compared with data from the CSAs, which were programmed to sample every five minutes. With data from the ADCPs, scientists could more easily estimate a roughness value, or how much vegetation pushes against water during the flow event, that could be plugged into the Manning equation.
Takeaways from Sycamore Creek and the Colorado River work aren’t yet fully clear, as data are still being analyzed. But there’s really no question to the usefulness of the information collected on each stream.
“(These data can be used) to refine our rating curves and improve stream flow data,” said Forbes. “Additionally, we can use these data to better understand how vegetation and channel change impacts river discharge in Arizona streams.”
Top image: Colorado River. (Credit: Public Domain)


0 comments