USGS Hydrologists Respond to Utah’s Hildale Flood
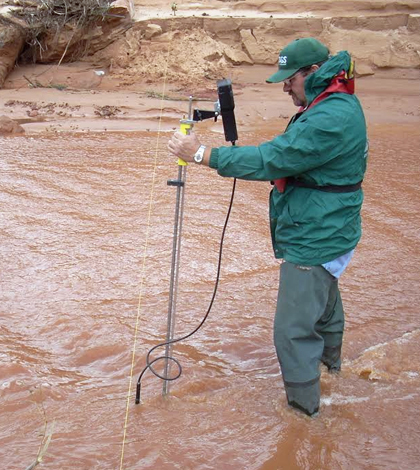
A USGS hydrographer measures flow in Short Creek after the flood event. (Credit: Jake Benson / USGS)
Last month, a massive rain event caused flash floods in the sister towns of Hildale, Utah and Colorado City, Arizona from September 14 to 16. The death toll so far remains at 20, including the seven canyoneers who lost their lives in a related flood in Zion National Park’s Keyhole Canyon and a man driving the backroads outside of Colorado City. State and county officials recently pulled their forces out of the search, leaving the effort to find the final missing victim to Hildale local authorities.
Cory Angeroth is a hydrologist with the U.S. Geological Survey (USGS) in Utah. He and his group of technicians are responsible for operating and maintaining instruments called streamgages, which are used by the state to monitor surface water and groundwater resources.
When hydrologists such as Angeroth and his team work with streamgages, they are concerned with two types of measurements: stream stage and stream discharge. The stage of a river is the height of the water above some constant, but arbitrary, reference point called a datum. The datum could theoretically be anywhere, but in practice is often located near the streambed. The second type of measurement is discharge, which is the volume of water that flows through the river channel per unit time.
Once stage-discharge measurement pairs are available for a variety of different stages of the river, a relationship called a rating can be established between the two variables. It is important to include a variety of stream conditions because erosion of the river channel could cause larger discharge volumes to flow through the channel at a constant stage. Similarly, if material is deposited in the channel causing its volume to decrease, the discharge could be less at the same stage.
Taken together, stage and discharge describe what hydrologists call streamflow. There are two ways to measure streamflow: directly and indirectly. We will first briefly discuss the direct measurement method before moving on to the indirect method used by hydrologist Bradley Slaugh in these photos from the USGS.

Example of a high water mark flagged by USGS hydrographers after the flood on Short Creek near Hildale, Utah. (Credit: Brad Slaugh / USGS)
Direct stage measurements occur continuously at the streamgage, using either a stilling well or a bubbling tube. In a stilling well, water is allowed to flow into the well through tubes buried underground. This ensures that the water level in the well matches the water level in the river, which is then measured either with a float like the one in your toilet or with an electronic sensor. The bubbling tube is an alternate method that relies on the fact that the pressure of an airstream maintaining a constant stream of bubbles underwater is directly related to the amount of water above the opening in the tube.
Direct discharge measurements are more involved than continuously recording stage, and are taken periodically as it is impossible to have someone constantly in the field. First the area of the river channel must be determined by combining the width and depth of a number of vertical subsections of the channel. After measuring the velocity of the water with a current meter, area and velocity are multiplied together to determine the discharge.
In the final leg of the data’s journey, stage information that is recorded every 15 minutes gets transmitted hourly over the Geostationary Operational Environmental Satellite to USGS computers. Here the stage data are transformed into streamflow data using the stage-discharge relationship (rating) that has been established and maintained by combining periodic discharge measurements with the continuous record of stage.
Of course none of this is possible if the USGS does not have a streamgage in the location of interest, as is the case with Short Creek. The USGS does, however, have streamgages approximately 60 river-miles downstream from Short Creek at Fort Pearce Wash and also at North Fork of the Virgin in Zion National Park. So on September 15 and again on September 22, USGS hydrologists went to Short Creek and made use of the indirect method to determine the river’s stage and discharge.
According to Angeroth, the indirect method “involves going out and measuring the high-water marks, surveying the high-water marks, surveying in cross sections (of the river channel) and then using a theoretical equation to determine the stream discharge.” The high-water marks are often lines of vegetation and debris that get deposited by the water as it recedes. The data are then fed into a mathematical model called the slope-area computation to yield information about peak discharge, which Angeroth said is currently being reviewed and should be available in “a couple of weeks.”

USGS hydrographers survey Short Creek to compute peak discharge of the flood event. (Credit: Brad Slaugh / USGS)
This indirect method is crucial because the streamgage closest to Short Creek is 60 river-miles downstream at Fort Pearce Wash — too far downstream to capture the true peak discharge that occurred in Short Creek. Parts of the indirect measurement process can be seen in the pictures that the USGS posted to their Facebook page. The first picture shows Slaugh “determining the stage of the river to a temporary reference mark that we established so that when we ran indirect we would have another point to bring into the analysis,” said Angeroth. That reference mark “was just a mark that he put on a big boulder.” In the second picture, Angeroth explains that “he’s making a discharge measurement and he’s using a SonTek Flow Tracker.”
All of this information about data collection and flood response still does not answer the question, “What caused the flood?” Angeroth addressed this by talking about two things: geology and topography. “There’s a lot of exposed sandstone which is a lot of mountains. So as these storms come in, they kind of run into the mountains and drop the rain on a lot of exposed rock. And that exposed rock then leads to a very rapid and extensive runoff,” said Angeroth. He continued by comparing the desert landscape of southern Utah with a more absorbent one. “So if the rain falls on a cornfield in Iowa, it’s relatively flat and there’s a thick soil there. You’re not going to get a lot of runoff. But if it falls on a mountain of sandstone in Utah, then a large percentage of the rain that hits the ground is going to run off.”
Once USGS scientists run the calculations and have knowledge of peak discharge, they use that information to calculate an annual exceedance probability. Angeroth lent this explanation: “Annual exceedance probability is the percent chance that a certain flow will occur that year. So, a 100-year flood event has a 1 percent chance of occurring in any year.”
Although we cannot yet be certain of the exceedance probability attached to the Hildale event, the flood as recorded at the North Fork of the Virgin streamgage had a 50 to 20 percent chance of happening in a year, making it a two- to five-year flow event, which is not uncommon. Beyond calculating exceedance probabilities, the USGS does not make predictions regarding future flood events, nor do they issue flood watches or warnings. The weather service takes USGS data and uses them to make predictions and issue watches and warnings.
To wrap up, Angeroth stressed the importance of collecting data for rare events. He also mentioned that USGS streamgages are cooperatively funded. “If there was interest for the USGS to make periodic measurements there or anything,” he said, “that’s something we could do if there were local or state agencies that were interested in helping to fund that effort.”
Top image: A USGS hydrographer measures flow in Short Creek after the flood event. (Credit: Jake Benson / USGS)


0 comments