USGS network brings real-time sensors to groundwater quality monitoring
Since 1988, a national groundwater quality monitoring program has watched for trends in contaminants by checking in on wells every 10 years. A new program is looking to add to that by picking up the pace considerably, collecting data every five minutes.
The U.S. Geological Survey’s new Enhanced Trends Network will help answer questions about the time scales at which groundwater quality changes. The data will contribute to more detailed interpretations of the 10-year trends analysis from the agency’s National Water-Quality Assessment Program, according to Justin Kulongoski, a research hydrologist with the USGS California Water Science Center. Researchers will fill in those long gaps with high-frequency data, looking for seasonal or even daily fluctuations at sites nationwide equipped with water quality sensors rarely used in groundwater studies.
“People do real-time data in streams and rivers with some of these new instruments, so we thought, ‘Let’s see if we can’t instrument some groundwater wells around the country and see how groundwater quality might fluctuate over very short time scales,'” Kulongoski said.
The network now stands at eight sites in varied geologic settings, including Texas’ karst, New Mexico’s deserts, Maryland’s coastal plains, New Hampshire and Wisconsin’s glacial deposits, Tennessee’s Mississippi embayment and Oregon’s Columbia flood basalt.
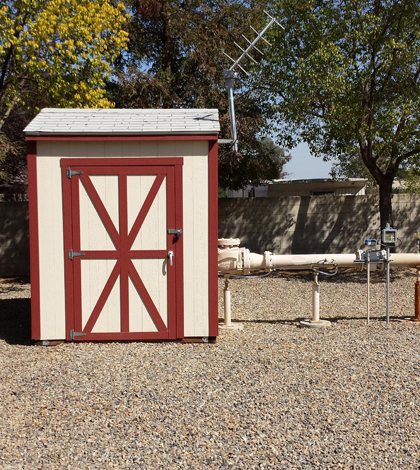
Kulongoski is the minder for a site near Fresno, California, dominated by alluvial deposts from the Sierra Nevada. He’s instrumented three wells there: two public supply wells and a monitoring well. Both public supply wells — one deep and one shallow — are equipped with YSI EXO1 multi-parameter sondes measuring temperature, specific conductance, pH and optical dissolved oxygen. The sondes are at the surface and sample in flow-through chambers. He said they originally tried to suspend the sondes down in the boreholes of the wells, but found that measurements reflected changes in borehole-water chemistry rather than what was happening in the actual aquifers. The station at the deep public well also has a Satlantic SUNA V2 optical nitrate sensor.

The deep well’s monitoring setup includes a YSI EXO1 (top right) and a Satlantic SUNA V2 (bottom center). (Credit: Justin Kulongoski)
Along with the sensor data, researchers have also sampled the wells near Fresno bimonthly for contaminants such as perchlorate and DBCP, a soil fumigant. Both are still around from legacy contamination, and they have a greater bearing on water’s potability than, say, dissolved oxygen. But the hope is the researchers will be able to draw connections between those contaminants and the parameters they’re measuring in real time.
The high-frequency data, which is available online, could also help answer questions about what drives changes in groundwater quality. For example, concentrations of something like arsenic might go up over time in water from a groundwater well. That could be the result of changes at the surface or the chemistry within the aquifer. But if the well draws water from both a shallow and a deep aquifer, as many do, the changing arsenic concentration may reflect a shift in which aquifer is providing the water.
“You might say arsenic is going up in this well,” Kulongoski said. “But what you’re really seeing is, as the water table declines, you’re sampling more deep water, which is older and has higher arsenic concentrations.”

A plot of real-time data from the Fresno site shows most parameters staying constant with a slight increase in salinity. (Credit: Justin Kulongoski)
The Fresno site has collected a year’s worth of data, which show that most parameters have stayed fairly constant. That’s not very exciting, Kulongoski said, but it’s also somewhat expected given the geology of the site. On the other hand, real-time data from monitoring stations in karst regions have shown that the groundwater is very responsive to rainfall events, with some parameters spiking as flashes of stormwater percolate down through the system.
“As a bigger study around the country, it’s interesting to be able to compare these different geologic settings to see where you might expect much more rapid water quality fluctuations, and to see how these high frequency data can help with interpreting decadal scale changes in water quality.”
Top image: A shed houses the real-time monitoring equipment at a public supply well in Fresno, California. (Credit: Justin Kulongoski)


0 comments