“WireWall” Measuring Flood Risk in Real Time
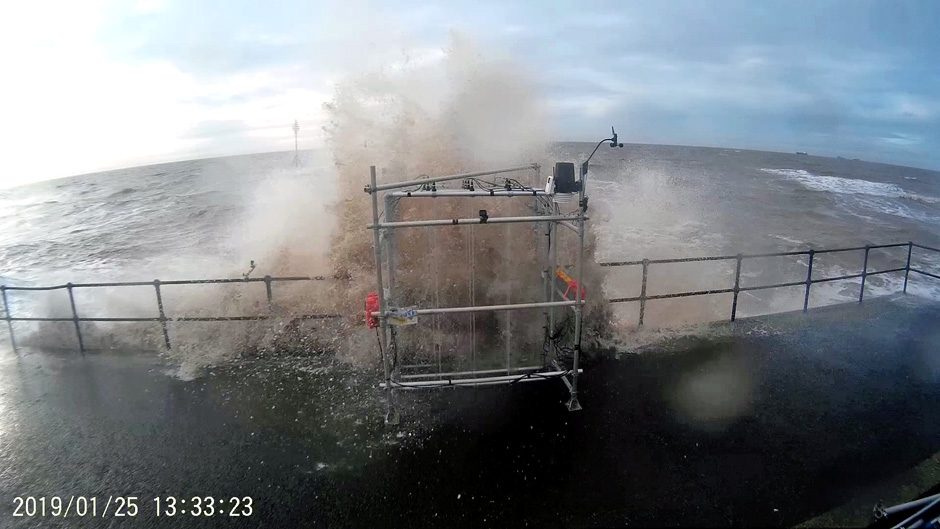 The "WireWall" collecting data. (Credit: National Oceanography Centre)
This past winter, physical oceanographer Jenny Brown and her team at the National Oceanography Centre (NOC), United Kingdom, were trialing a new concept: “WireWall” with colleagues at HR Wallingford. This new system for measuring wave hazard at sea walls allows managers to understand flood risk for existing coastal structures better, and Dr. Brown spoke to EM about the system and what inspired it.
“Traditional sensors don’t work in spray conditions,” explains Dr. Brown. “We’ve got a lot of oceangoing sensors that measure currents, water depths, all sorts of information, but the second you put them on land and out of solid water, they don’t work, often because they’re acoustic systems.”
However, a wide range of measurements is essential to plan and design new sea defenses. The key measurements are the volume and speed of wave jets and spray passing over the top of a defence during stormy conditions.
“How the heck were we going to get those measurements to calibrate the numerical tools used in the design of new sea walls?” muses Dr. Brown. “Because without that, there’s a lot of uncertainty, and the tolerances for the safety thresholds are perhaps higher than they need to be to ensure people are safe. The driver behind our sensor development was the idea that there could be a huge cost saving when building new sea defences if we could develop an instrument that would measure the required data.”
“The sampling frequencies of the electronics haven’t been quick enough to capture such fast jets of water in the past, so we haven’t had the capabilities to make these measurements until quite recently,” details Dr. Brown. “So the need has been there, and it’s been a problem in many locations. Now, with sea levels rising that need is becoming more acute, because water levels are allowing waves to come higher up historic sea defences.”
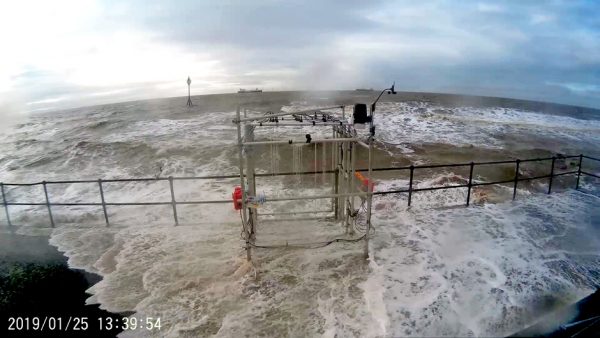
The “WireWall” during a stormy day. (Credit: National Oceanography Centre)
This is where the ’team’s technology comes into play.
“The wires have a capacitance and ground wire, and when the water hits the pair of wires it sends a signal,” Dr. Brown describes. “We have a grid of wires, and we can calibrate that signal into what length of wire is wet. By knowing the spacing of the wires and when they’re hit, we can calculate a speed. By knowing the lengths of wire that are wet, we can calculate a discharge, so we know the volume of water ’that’s passing through the wire grid.”
Finally, using WireWall, the team can generate a picture of the volume of water overtopping the wall to calibrate overtopping prediction tools to prove the concept. Obviously, such a system needs to be calibrated initially, but Dr. ’Brown’s team has confirmed the ’system’s performance in a wave flume at HR Wallingford.
“We’re showing that the technology works at a single point on a sea wall,” clarifies Dr. Brown. “If you wanted to collect information along the whole sea wall, you would need lots of these systems, because conditions will vary in different locations depending on whether the beach is a little bit higher or lower.”
The system is also customizable, flexible, and scalable, constructed of scaffold poles and capable of being smaller or bigger depending on the application.
“At the minute it’s clamped to the railings and bolted down, but you could reconfigure it to work on whatever sea wall you had in mind,” adds Dr. Brown.
This is a relatively low-cost solution for measuring hazardous wave events in terms of the initial outlay, although there are ongoing costs.
“The only real costs are the staff time to generate a design that works for your sea wall and to process the data, because it’s quite noisy,” remarks Dr. Brown. “Waves come in from all different directions, so we need to identify if the waves come from the left, the right or straight through. At the moment, we use video camera footage to confirm what our analysis of the data is telling us, which means someone has to visually check at least some of the results by replaying the video. The actual instrument itself is very low cost, and as we get more data, we will become more confident in the analysis methods which will reduce, and eventually eliminate, the need for visual checking.”
“We went out on every windy spring tide because we’ve never done this before, and we wanted to get as much data as possible to be able to show it was working,” states Dr. Brown. “We had to install cameras on the rig when we put it on the sea wall so we could see what was going on, to be able to explain the patterns we had in the data.”
Eventually, there may be a role for a machine learning system in tandem with the “WireWall.”
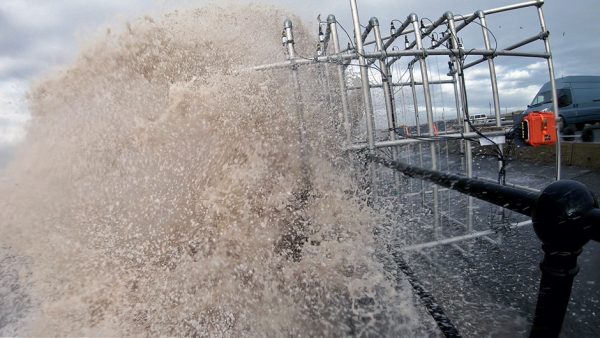
A close-up of the “WireWall” (Credit: National Oceanography Centre)
“We have people at the NOC that do machine learning, and we have been talking about how we could we use the data as a training dataset for these tools,” comments Dr. Brown. “We would need to make the system more robust to allow longer deployments to collect such datasets.”
At the moment the team deploys the system for one tide and then returns it to the lab to process the data, but for machine learning to function properly, it would require significantly more data.
“You would have to measure for a whole winter season, perhaps every high water,” Dr. Brown says. “The waterproofing would have to be improved so it could be left out there for a lot longer because if water gets into the connectors, the data won’t retain such high quality. We’ve been checking them after each deployment and allowed for built-in redundancy in our initial tests. So far, the data looks good.”
Next steps for the team? Opening up the system for use by more people and acquiring more data.
“If you could train a local authority to be there regularly, looking after and perhaps changing wires weekly, that might work,” explains Dr. Brown. “Our next step will be making an instrument that could go out for a whole winter. We would like to win another project to look at the system design so it could do something similar, but with less maintenance. This was really the proof of concept: does the technology collect the measurements we want over a tidal cycle?”
In any event, the research surrounding this system has provided something unique: the first-ever measurements of wave overtopping speed in the field.
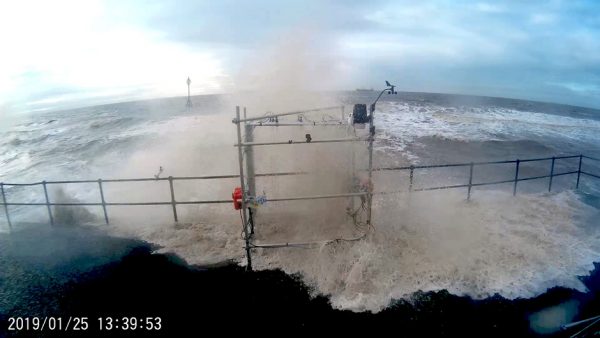
An image of the “WireWall”(Credit: National Oceanography Centre)
“People have previously collected volume using large tanks behind a sea wall, but a tank only gives you the volume of water it collects, it doesn’t actually get the speed,” remarks Dr. Brown. “The momentum of the water is a hazard because that’s what could knock people over. So in addition to the volume, which could cause a car to float away or would be against the front door of your home, the actual speed of the water is also quite important for public safety—and that’s a new dataset that we’ve managed to collect.”
“The waves coming over the sea wall might knock you over, but if the water then rushes back as it drains off the defence, you could be washed off the sea wall,” adds Dr. Brown. “So knowing the velocity is quite useful for coastal managers.”


0 comments